| figure, table | reference | variable | location | area | position | period (YYY1M1-YYY2M2) | mosquito species | note |
|---|
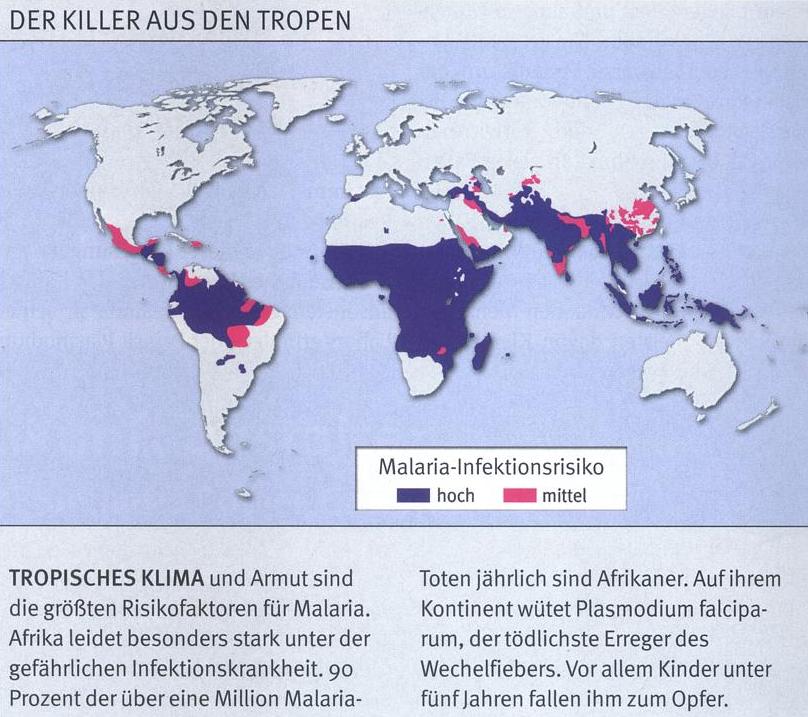
 | Bild Der Wissenschaft 2006 (fig. 1) | malaria risk | world | - | - | - | - | - |
|---|
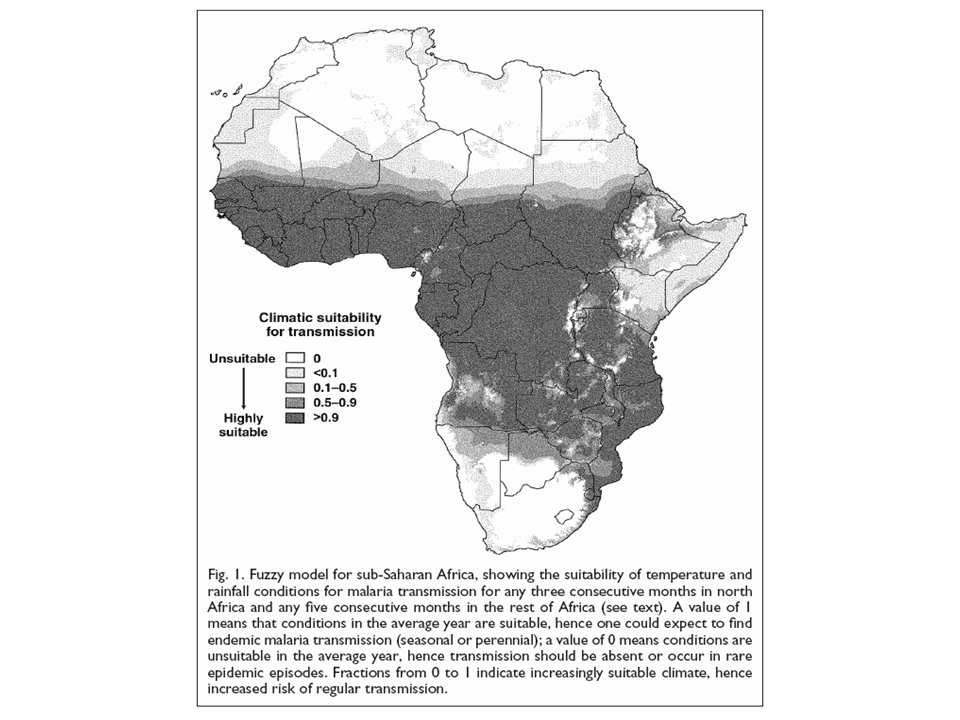
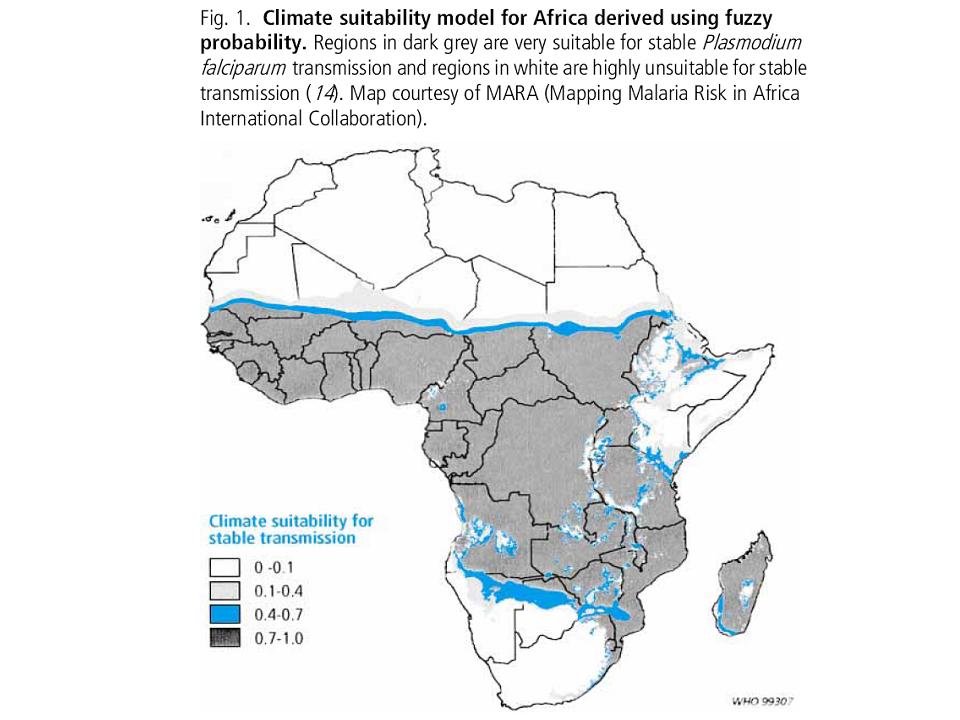
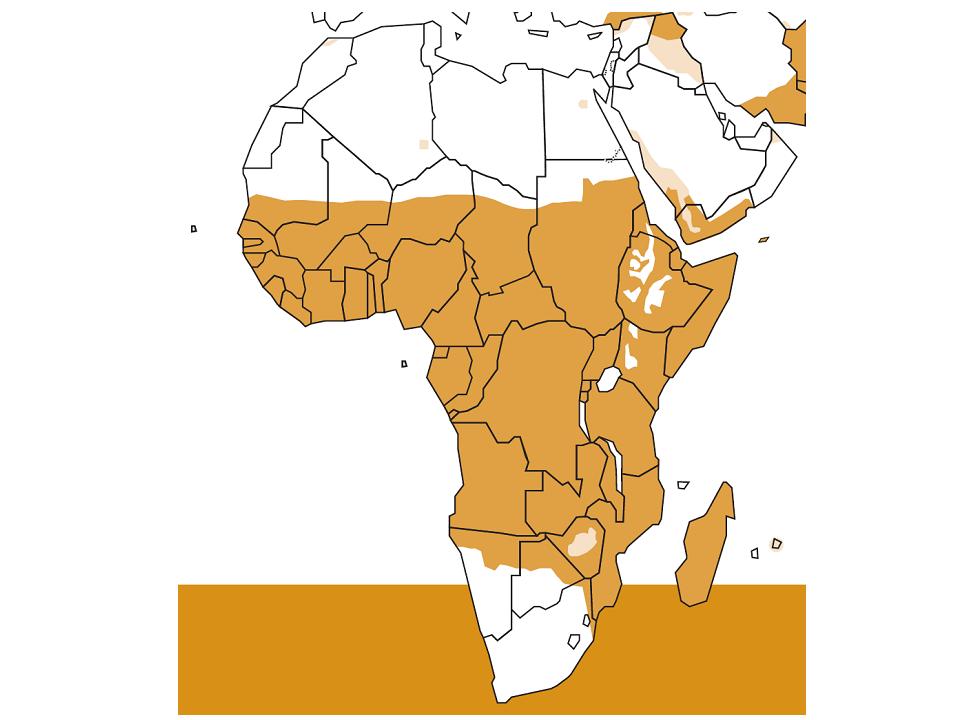
 | Craig et al. 1999 (fig. 1) | climatic suitability of transmission | Africa | - | - | - | - | MDM results |
|---|
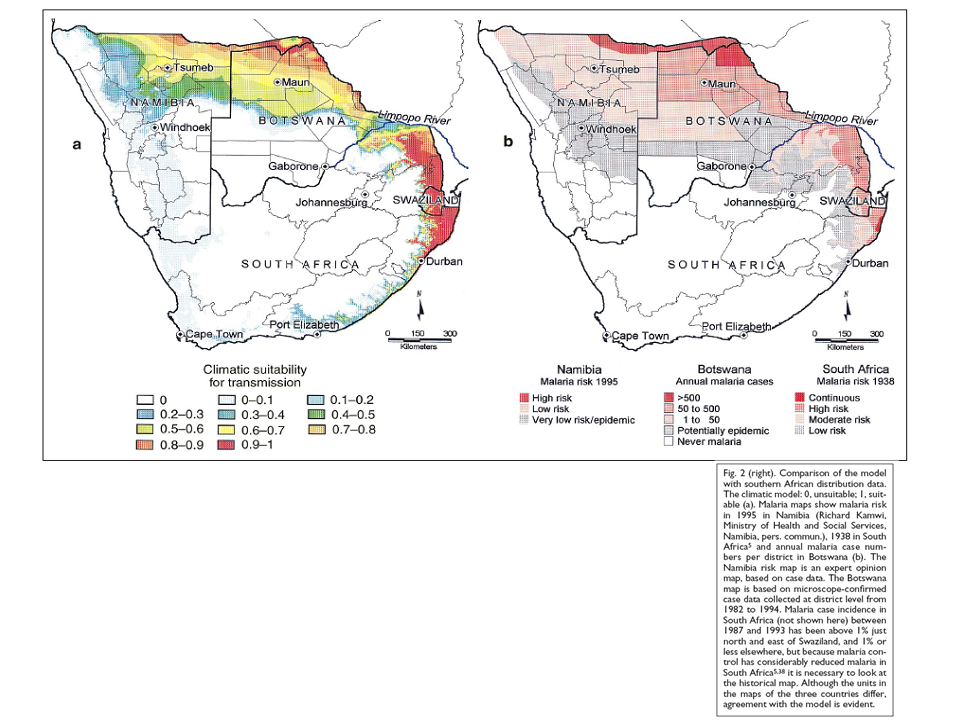
 | Craig et al. 1999 (fig. 2) | climatic suitability of transmission, expert opinion map | southern Africa | - | - | - | - | MDM results |
|---|
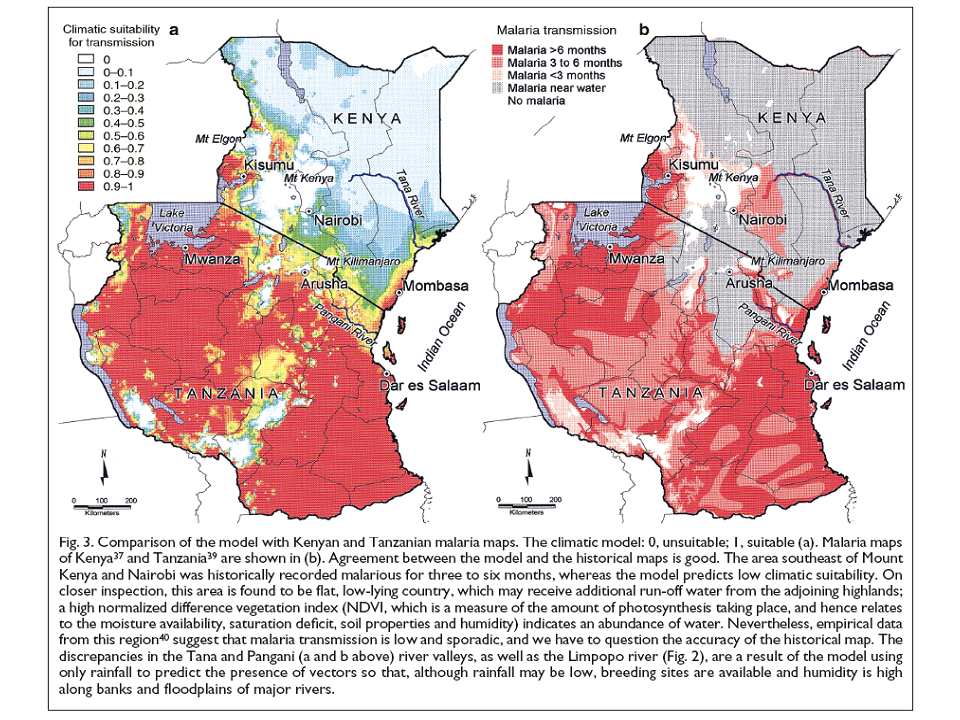
 | Craig et al. 1999 (fig. 3) | climatic suitability of transmission, expert opinion map | Kenya, Tanzania | - | - | - | - | MDM results |
|---|
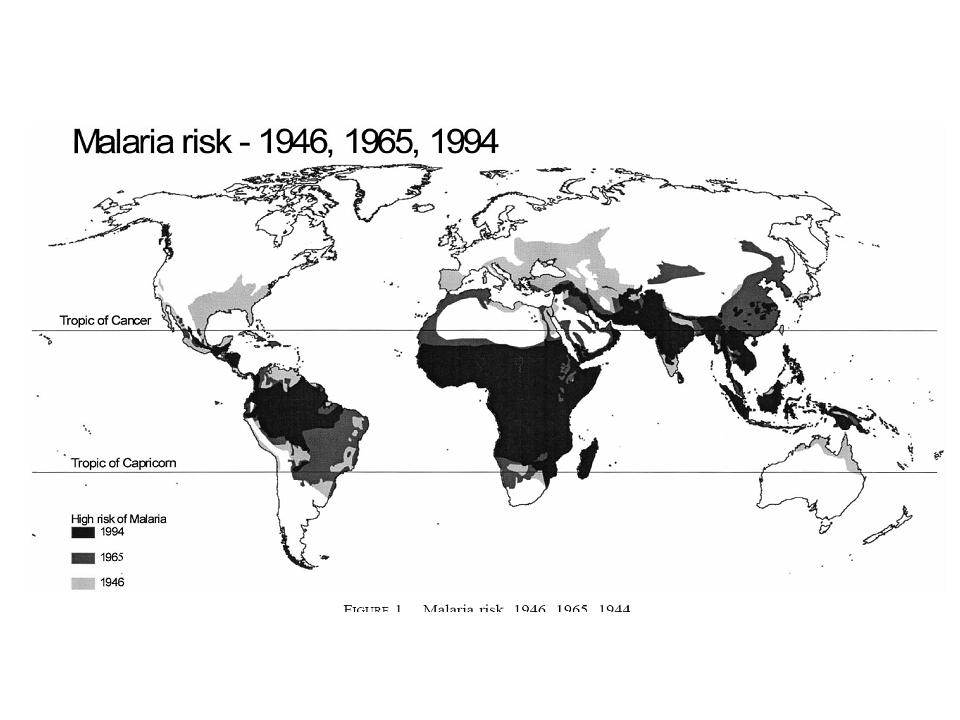
 | Gallup and Sachs 2001 (fig. 1) | malaria risk | world | - | - | 1946, 1965, 1994 | - | historical development of the malaria risk in the world |
|---|
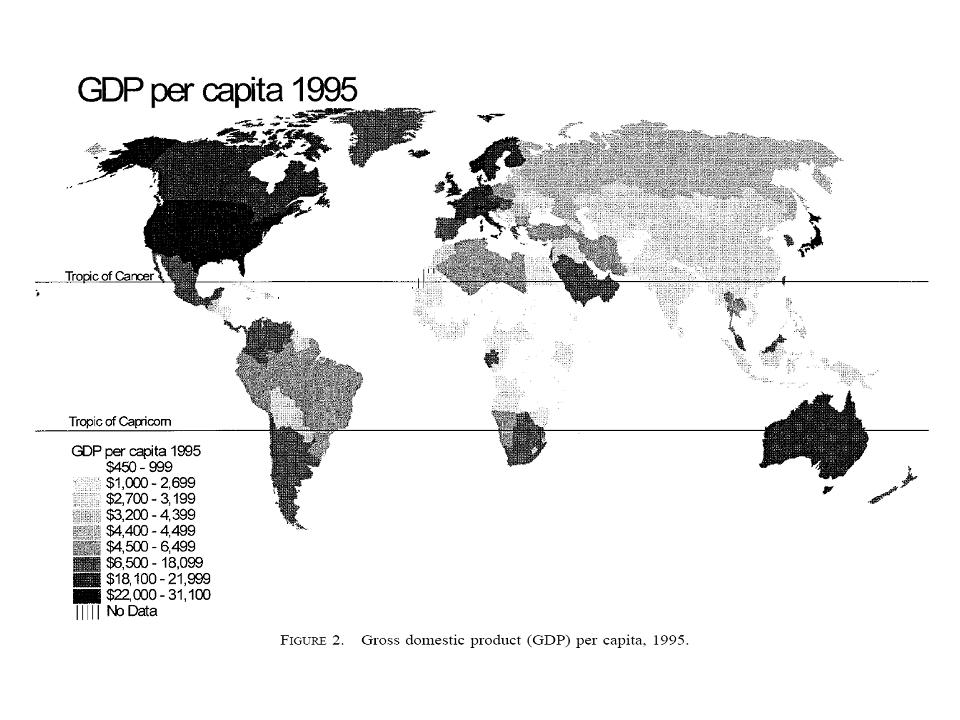
 | Gallup and Sachs 2001 (fig. 2) | gross domestic product per capita | world | - | - | 1995 | - | malaria and econmic growth |
|---|
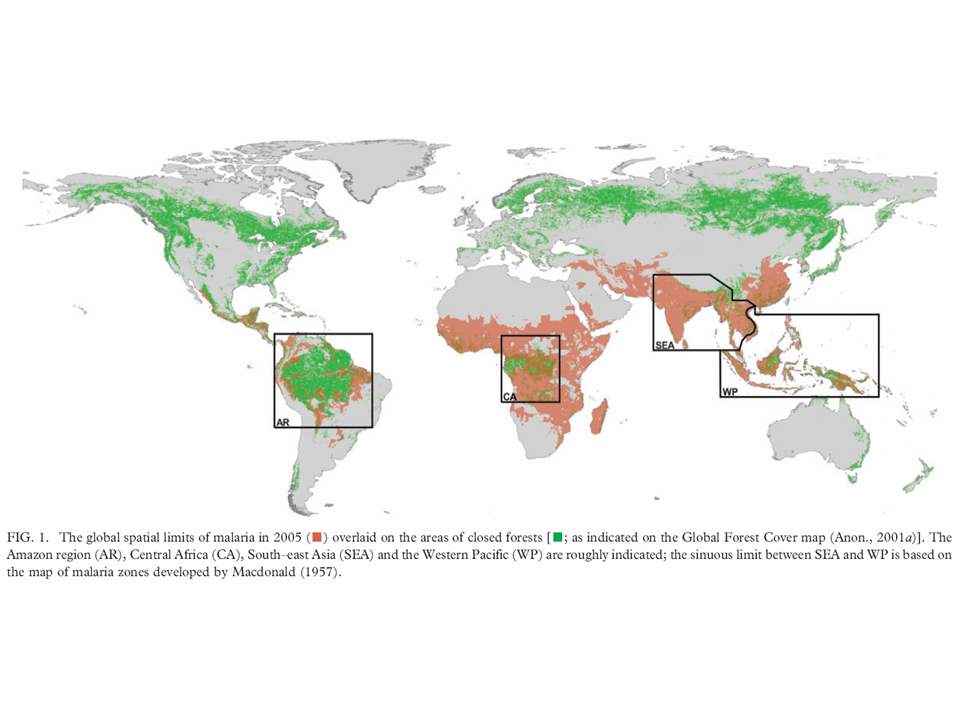
 | Guerra et al. 2006a (fig. 1) | spatial limits of malaria, areas of closed forests | world | - | - | 2005 | - | - |
|---|
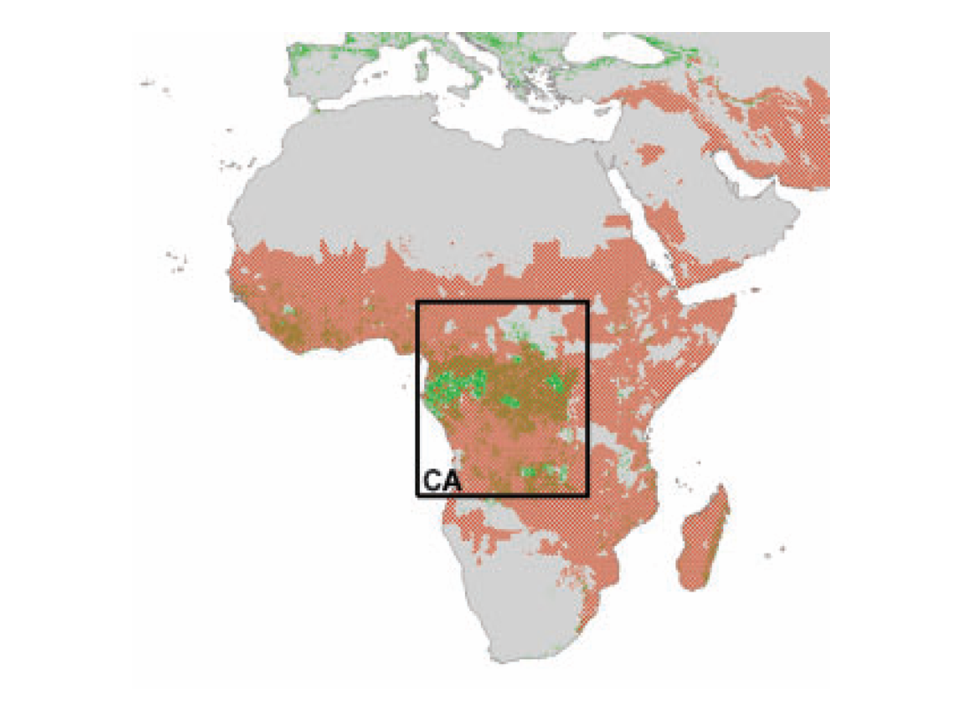
 | Guerra et al. 2006a (fig. 1 Africa) | spatial limits of malaria, areas of closed forests | Africa | - | - | 2005 | - | - |
|---|
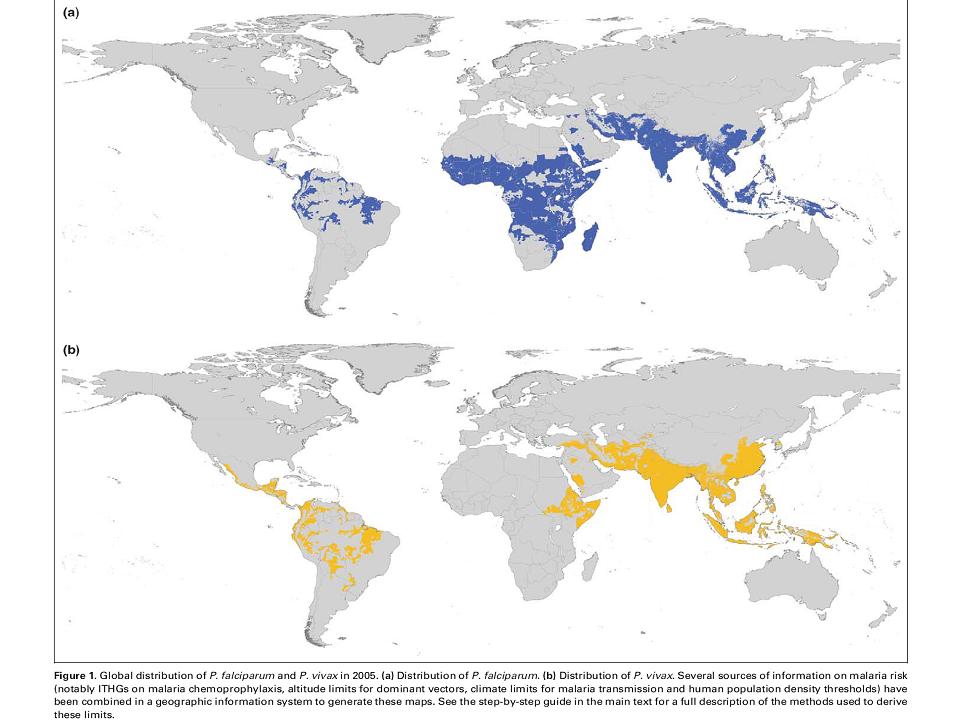
 | Guerra et al. 2006b (fig. 1) | distribution of Plasmodium falciparum/vivax | world | - | - | 2005 | - | - |
|---|
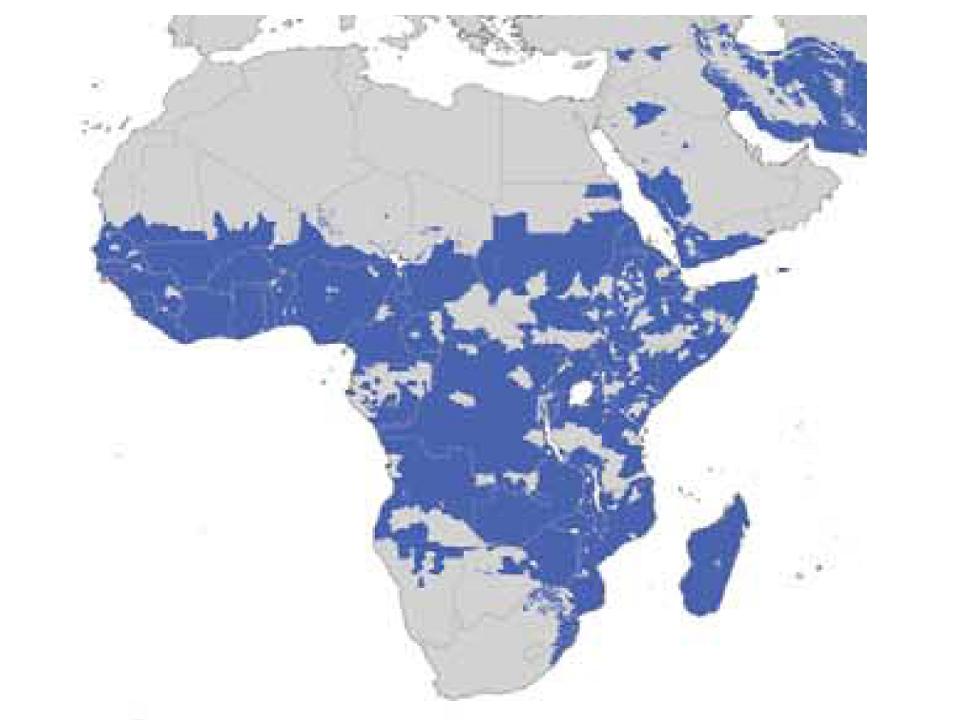
 | Guerra et al. 2006b (fig. 1 Africa) | distribution of Plasmodium falciparum/vivax | Africa | - | - | 2005 | - | - |
|---|
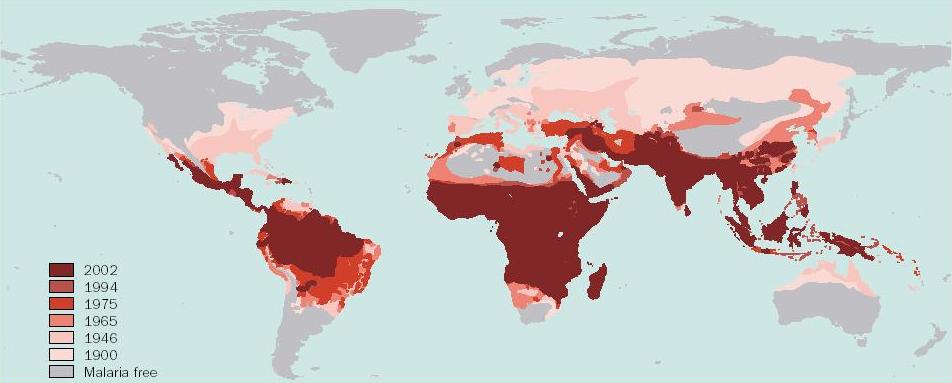
 | Hay et al. 2004 (fig. 1) | distribution of malaria | world | - | - | 1900, 1946, 1965, 1975, 1994, 2002 | - | - |
|---|
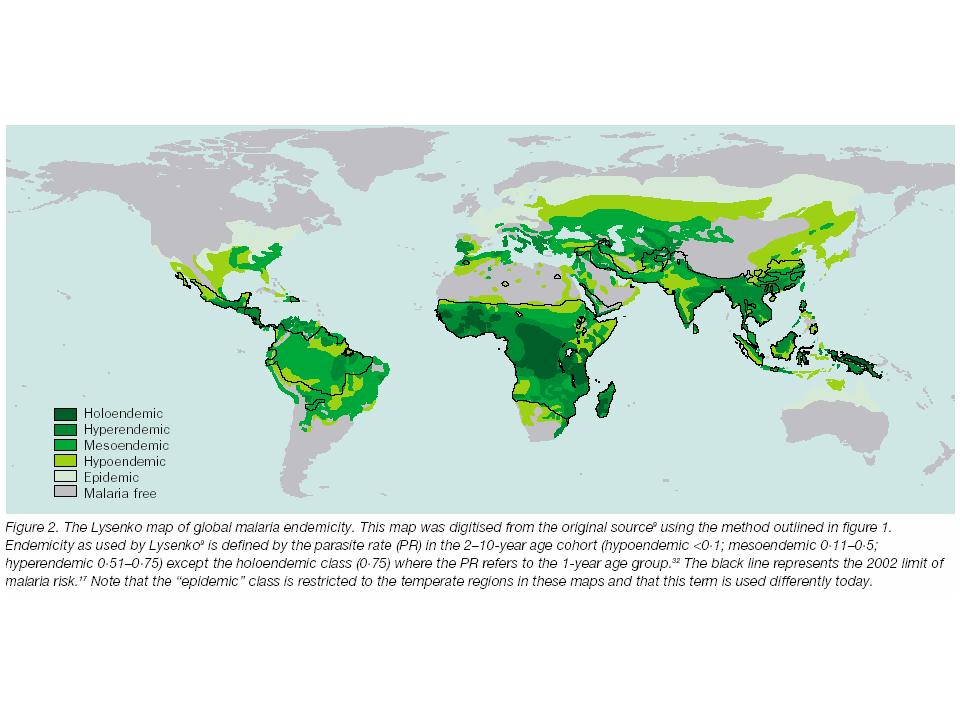
 | Hay et al. 2004 (fig. 2) | distribution of malaria endemicity, limit of malaria risk | world | - | - | 1968, 2002 | - | source: Lysenko and Semashko (1968) |
|---|
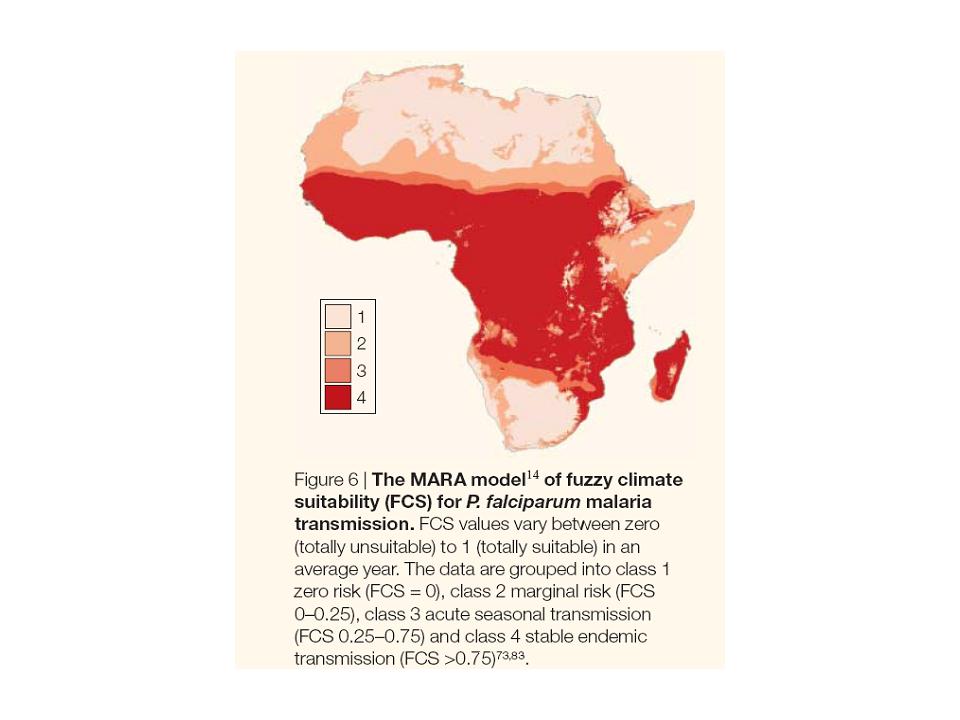
 | Hay et al. 2005a (fig. 6) | climatic suitability of transmission | Africa | - | - | - | - | MDM results |
|---|
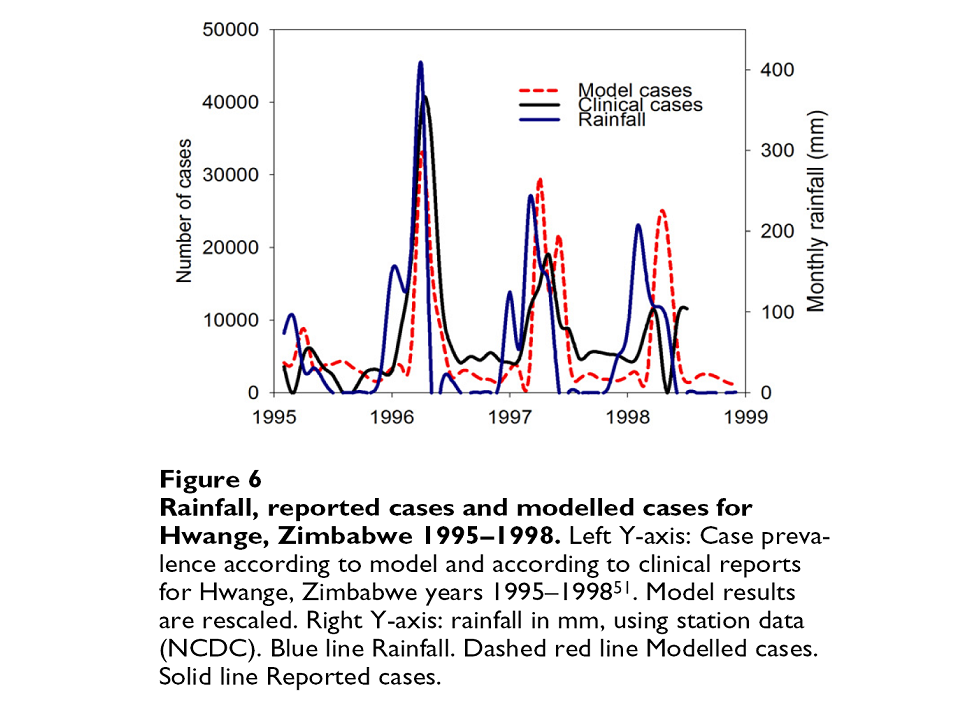
 | Hoshen and Morse 2004 (fig. 6) | INCa | Africa | - | - | 198701-200001 | - | LMM result |
|---|
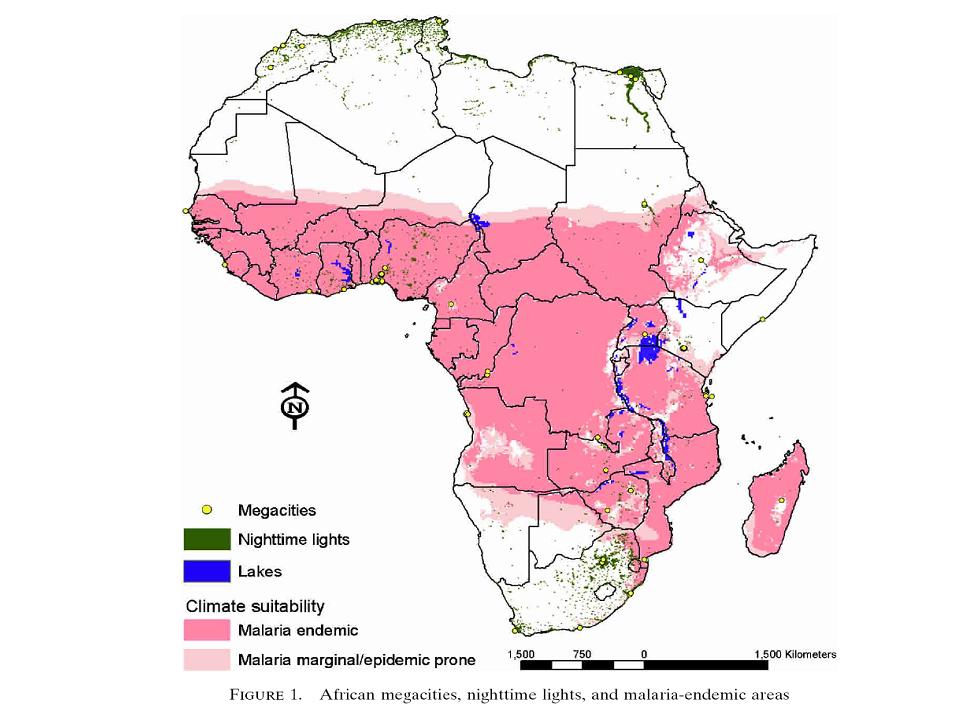
 | Keiser et al. 2004 (fig. 1) | Mega cities, nighttime lights, climatic suitability of transmission | Africa | - | - | - | - | fuzzy index based on climate variables |
|---|
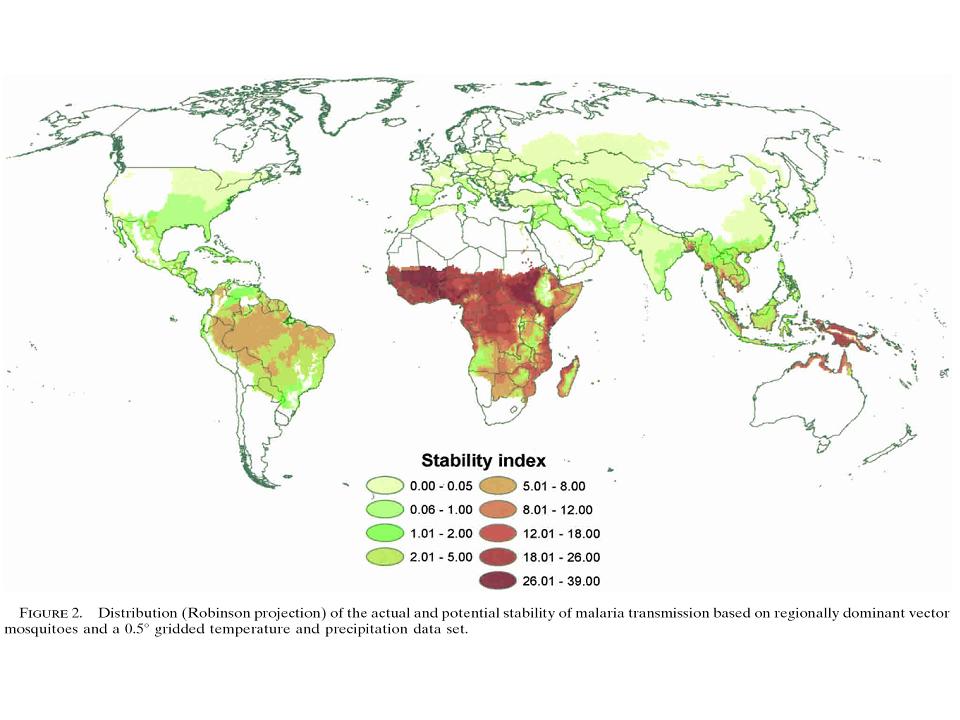
 | Kiszewski et al. 2004 (fig. 2) | malaria stability index | world | - | - | - | - | based on dominant vector mosquitoes, T and RR |
|---|
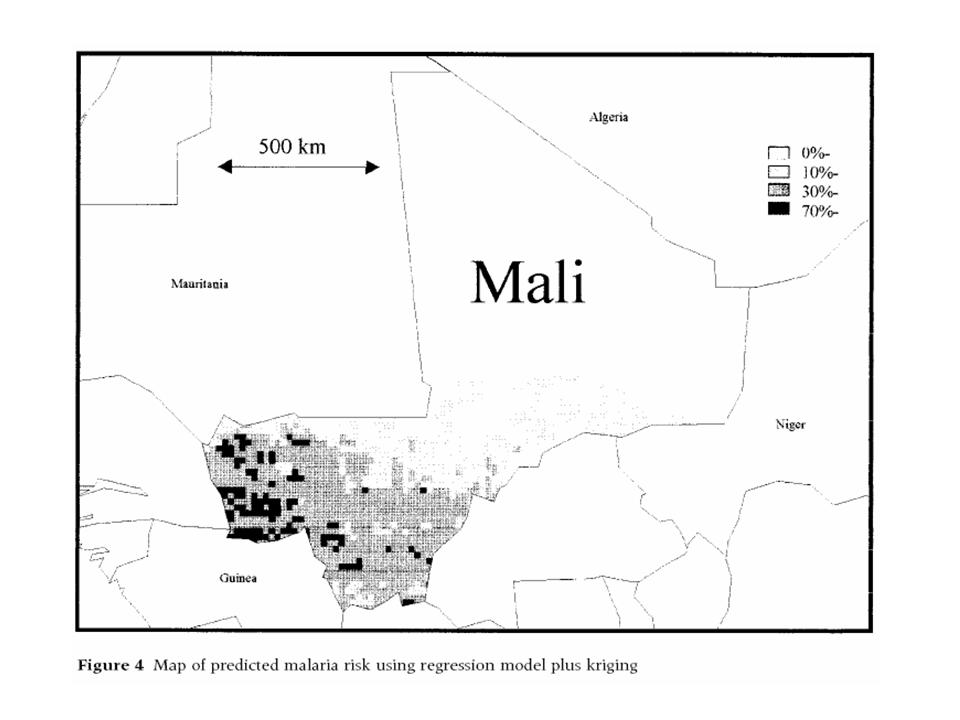
 | Kleinschmidt et al. 2000 (fig. 4) | predicted malaria risk | Mali | - | - | - | - | - |
|---|
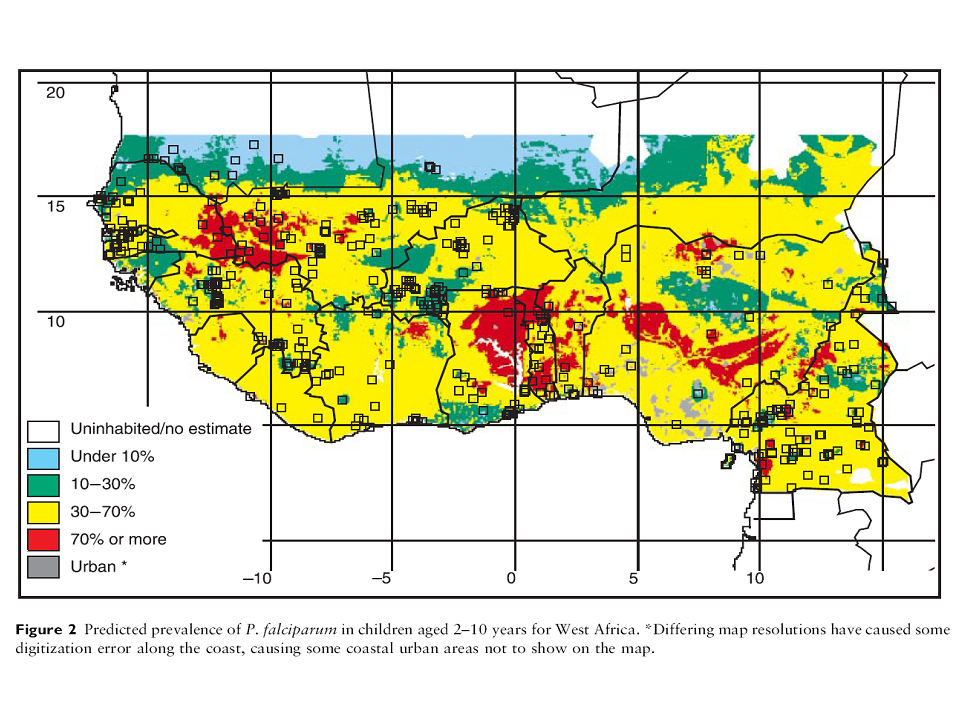
 | Kleinschmidt et al. 2001 (fig. 2) | predicted PR | West Africa | - | - | - | - | children from 2-10 years |
|---|
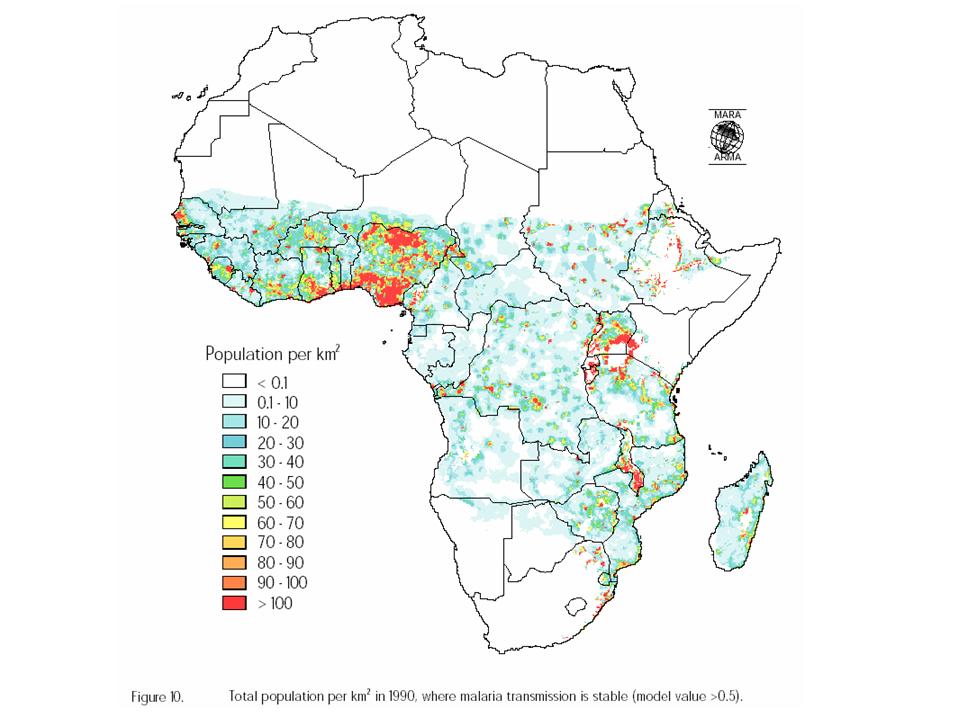
 | MARA/ARMA 1998 (fig. 10) | population in stable malaria transmission areas | Africa | - | - | - | - | MDM results |
|---|
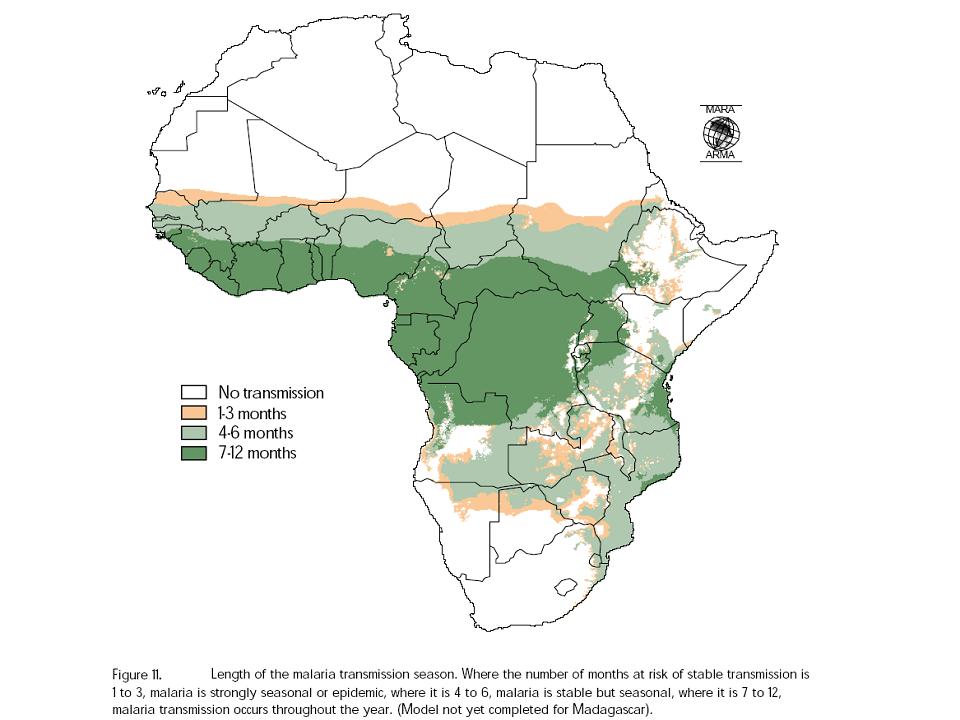
 | MARA/ARMA 1998 (fig. 11) | length of malaria season | Africa | - | - | - | - | MSM results |
|---|
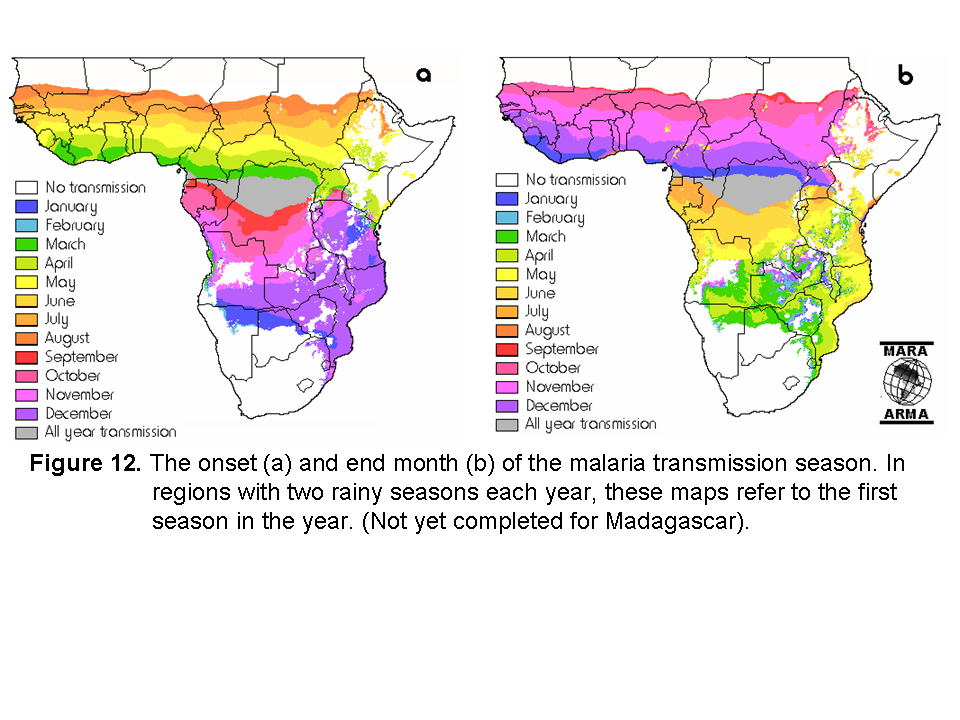
 | MARA/ARMA 1998 (fig. 12) | start and end of malaria season | Africa | - | - | - | - | MSM results |
|---|
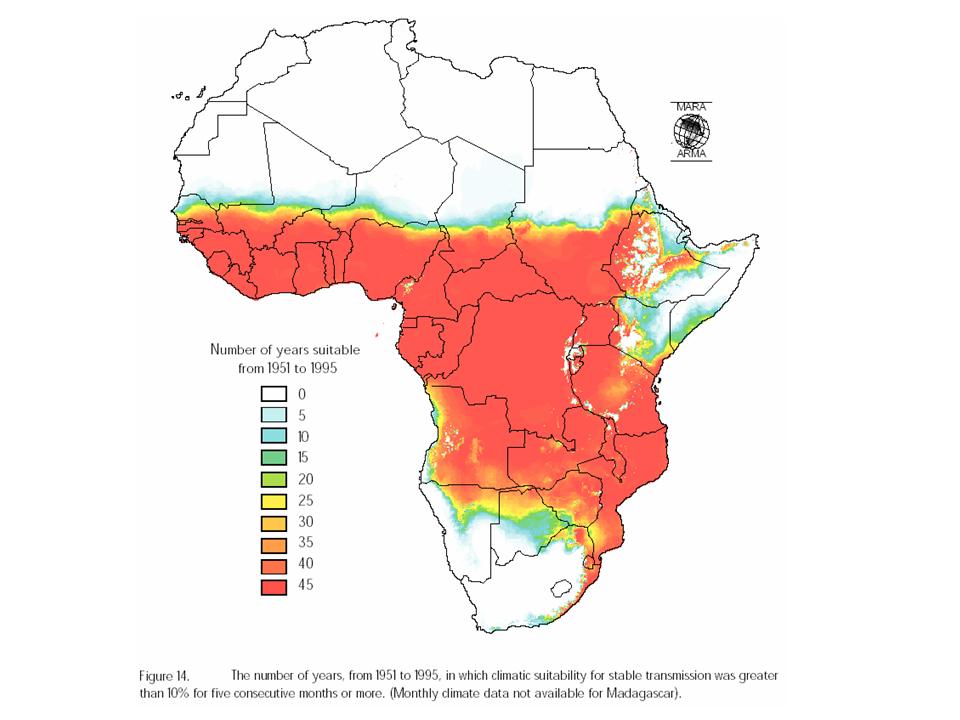
 | MARA/ARMA 1998 (fig. 14) | number of years suitable for malaria | Africa | - | - | - | - | MDM results |
|---|
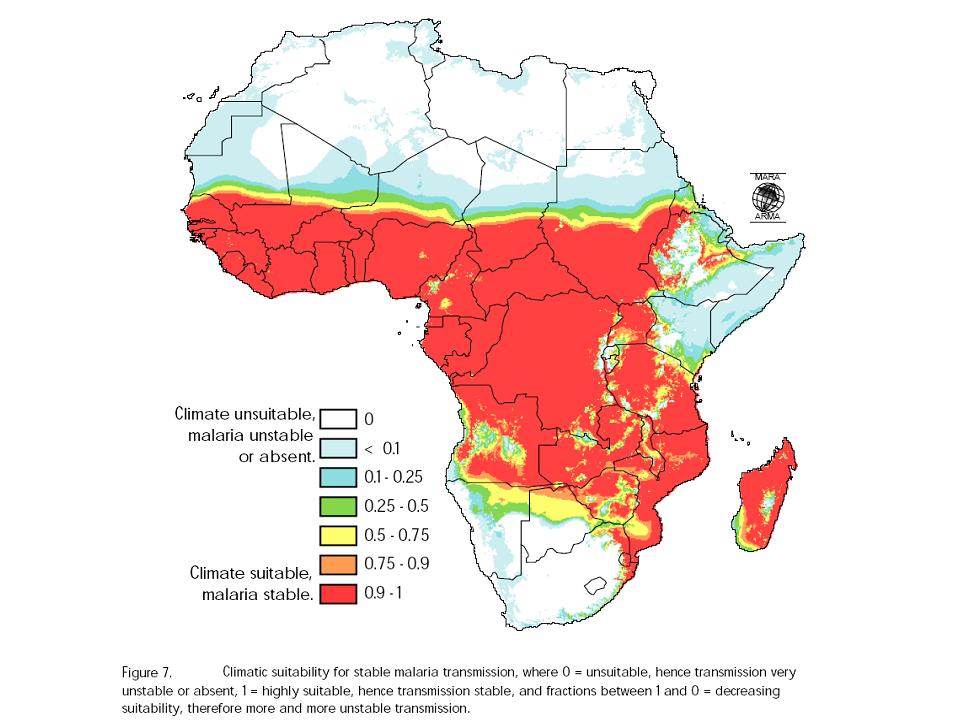
 | MARA/ARMA 1998 (fig. 7) | climatic suitability of transmission | Africa | - | - | - | - | MDM results |
|---|
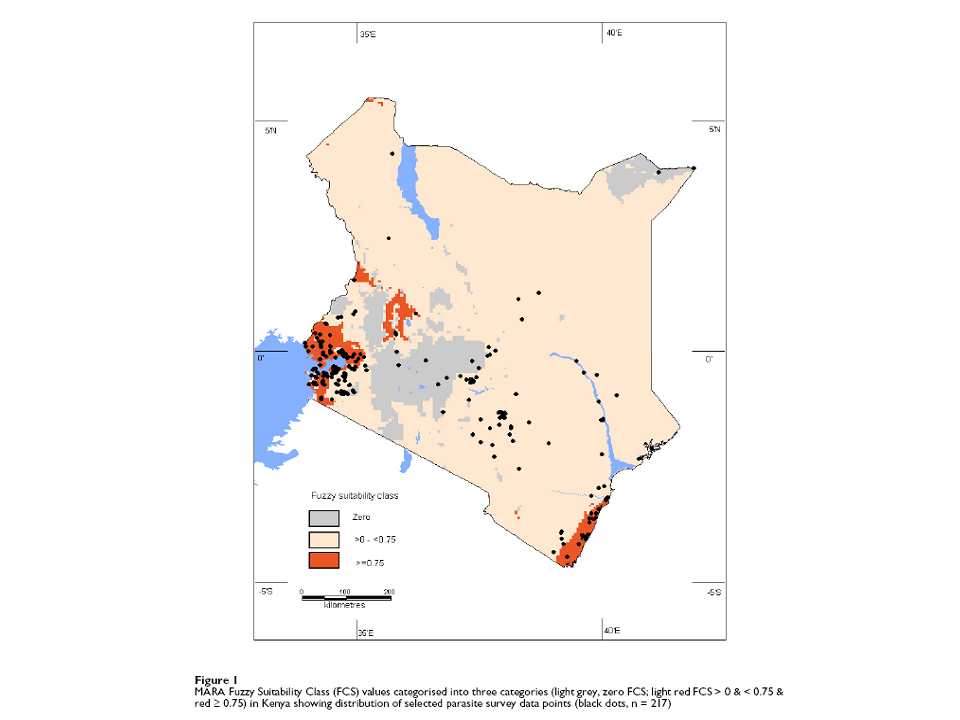
 | Omumbo et al. 2004 (fig. 1) | fuzzy climate suitabilty | Kenya | - | - | - | - | MDM results |
|---|
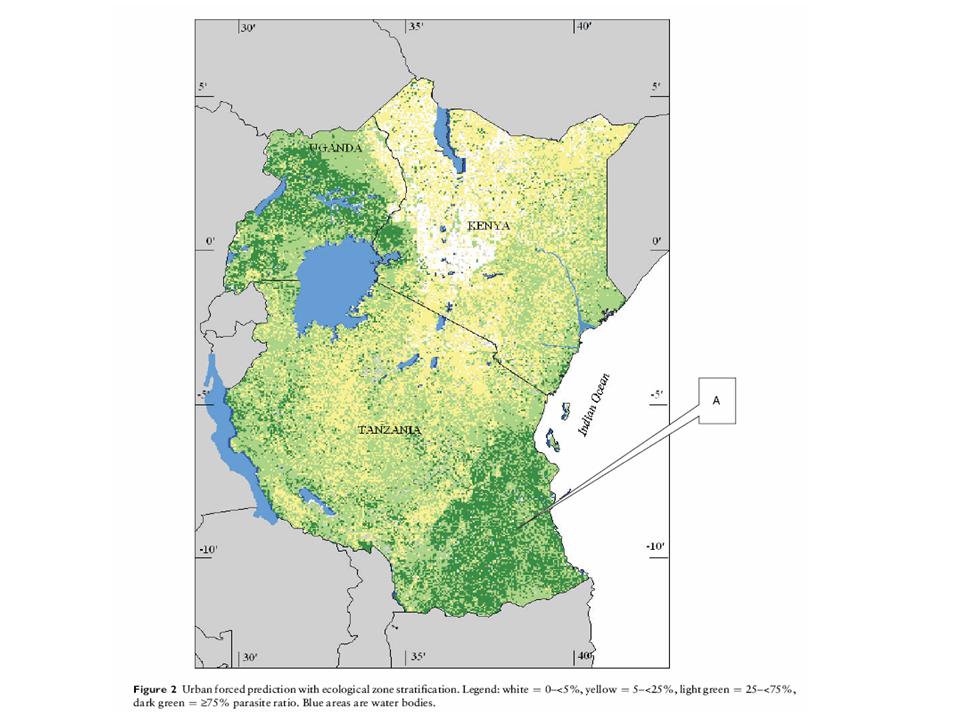
 | Omumbo et al. 2005 (fig. 2) | predicted PR | Kenya, Uganda, Tanzania | - | - | - | - | urban forced prediction with ecological zone stratification |
|---|
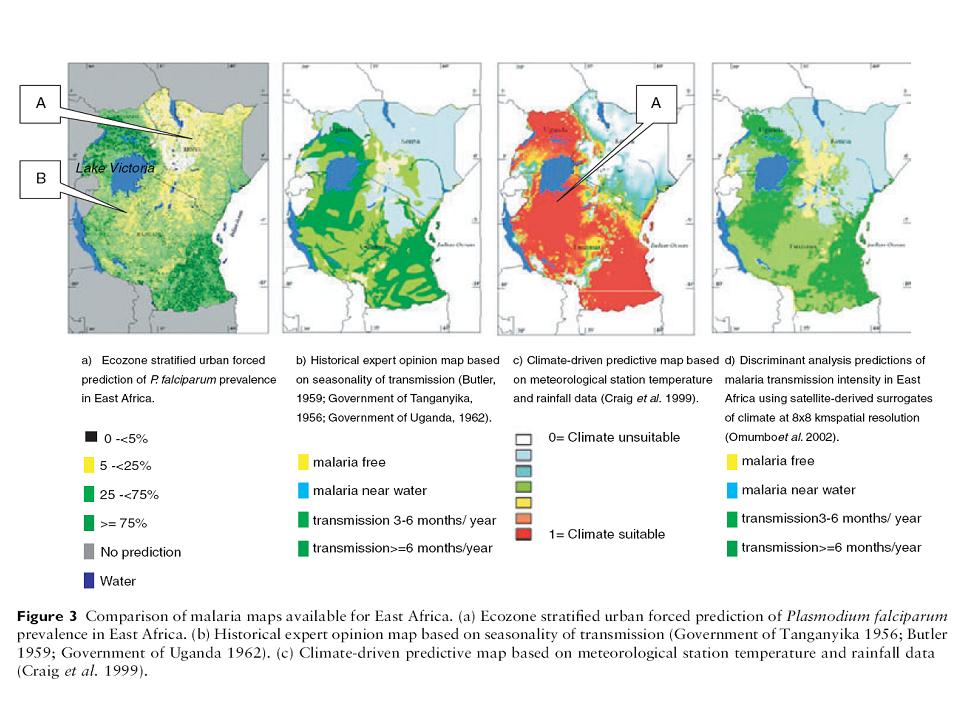
 | Omumbo et al. 2005 (fig. 3) | malaria distribution | Kenya, Uganda, Tanzania | - | - | - | - | map comparison |
|---|
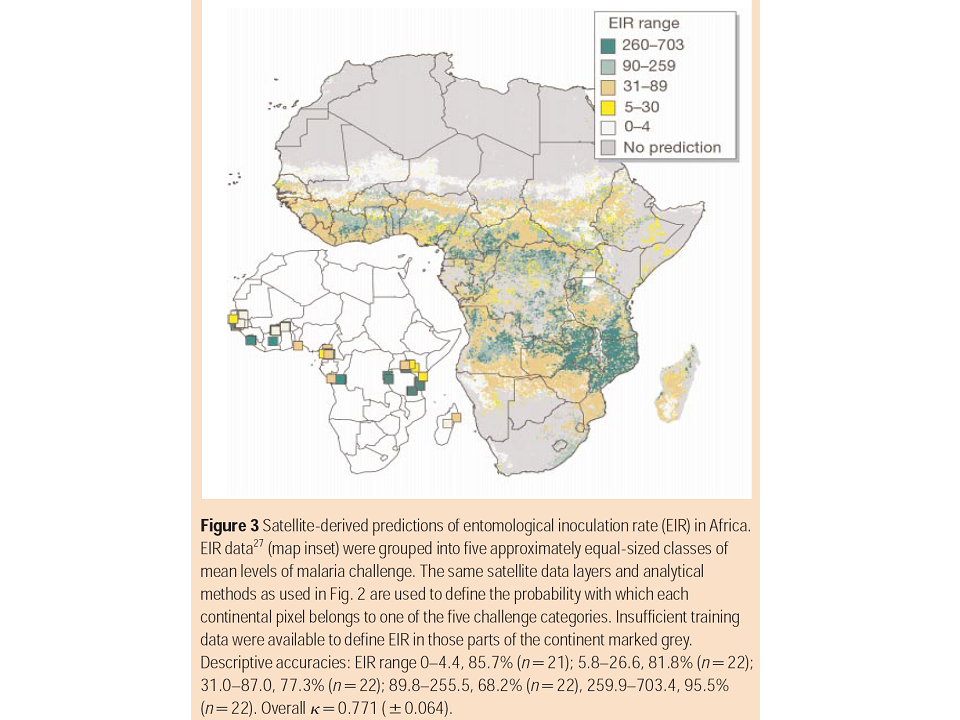
 | Rogers et al. 2002 (fig. 3) | predicted and observed EIRa | Africa | - | - | - | - | could be used for LMM validation |
|---|
 | Sachs and Malaney 2002 (fig. 1) | distribution of malaria risk | world | - | - | 1946, 1966, 1994 | - | - |
|---|
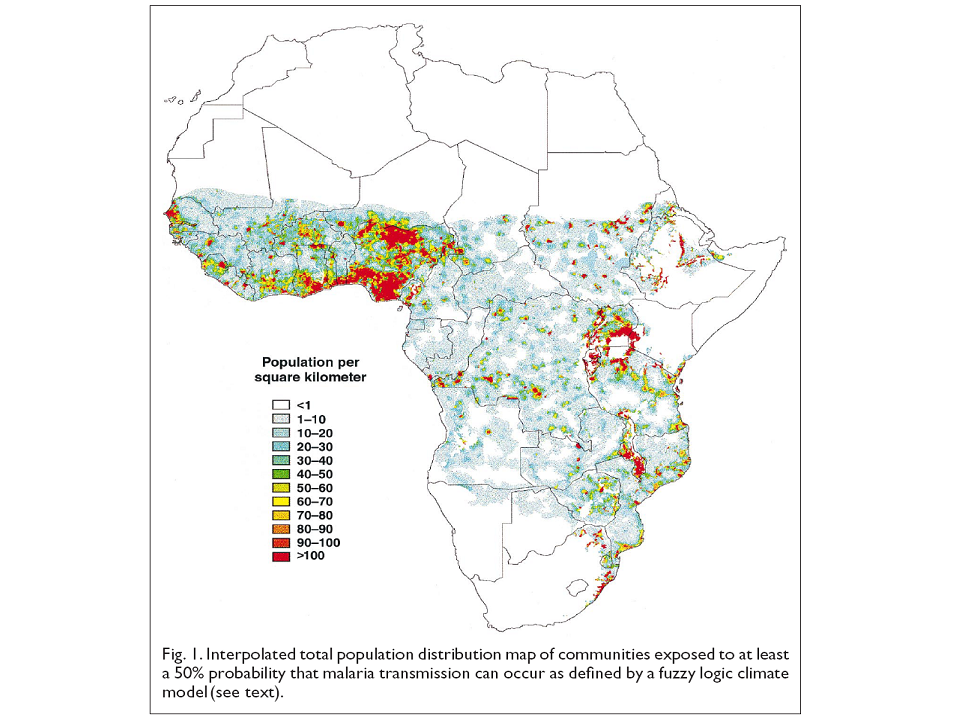
 | Snow et al. 1999a (fig. 1) | climatic suitability of transmission | Africa | - | - | - | - | MDM results |
|---|
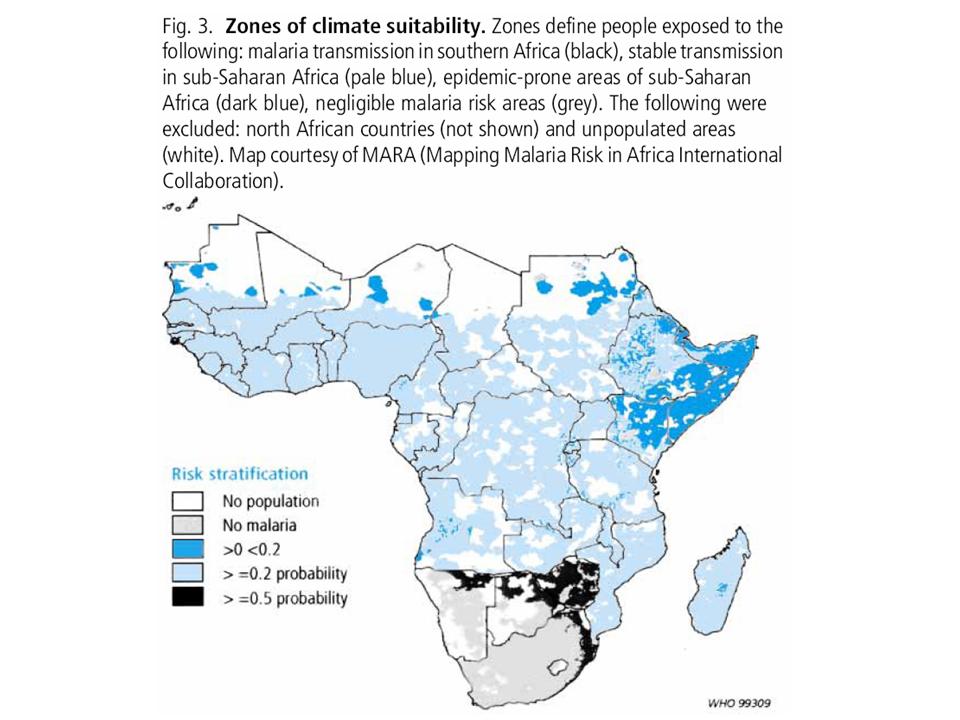
 | Snow et al. 1999a (fig. 3) | zones of climate suitability of malaria | sub-Saharan Africa | - | - | - | - | MDM results |
|---|
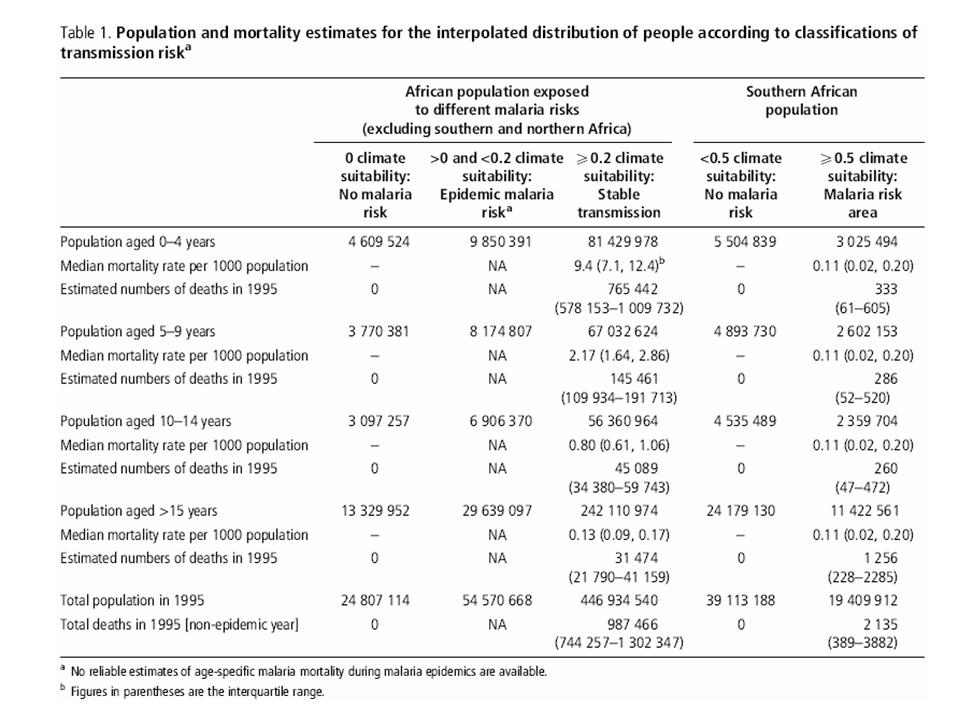
 | Snow et al. 1999a (tab. 1) | population and mortality estimates according to classifications of malaria risk | sub-Saharan Africa | - | - | - | - | MDM results |
|---|
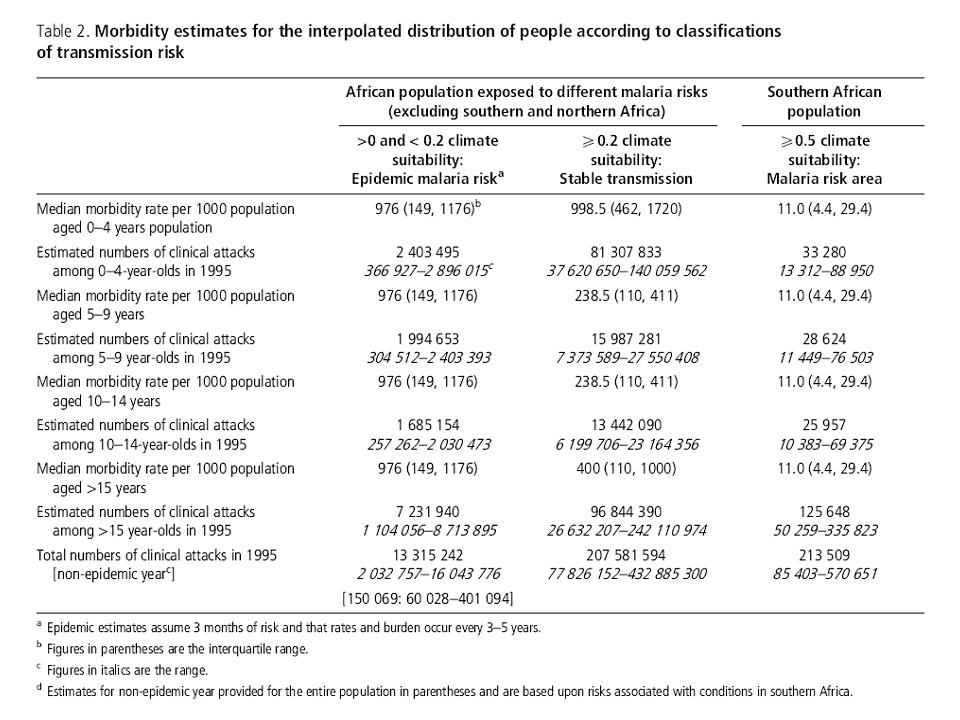
 | Snow et al. 1999a (tab. 2) | morbidity estimates according to classifications of malaria risk | sub-Saharan Africa | - | - | - | - | MDM results |
|---|
 | Snow et al. 1999b (fig. 1) | population in stable malaria transmission areas | Africa | - | - | - | - | MDM results |
|---|
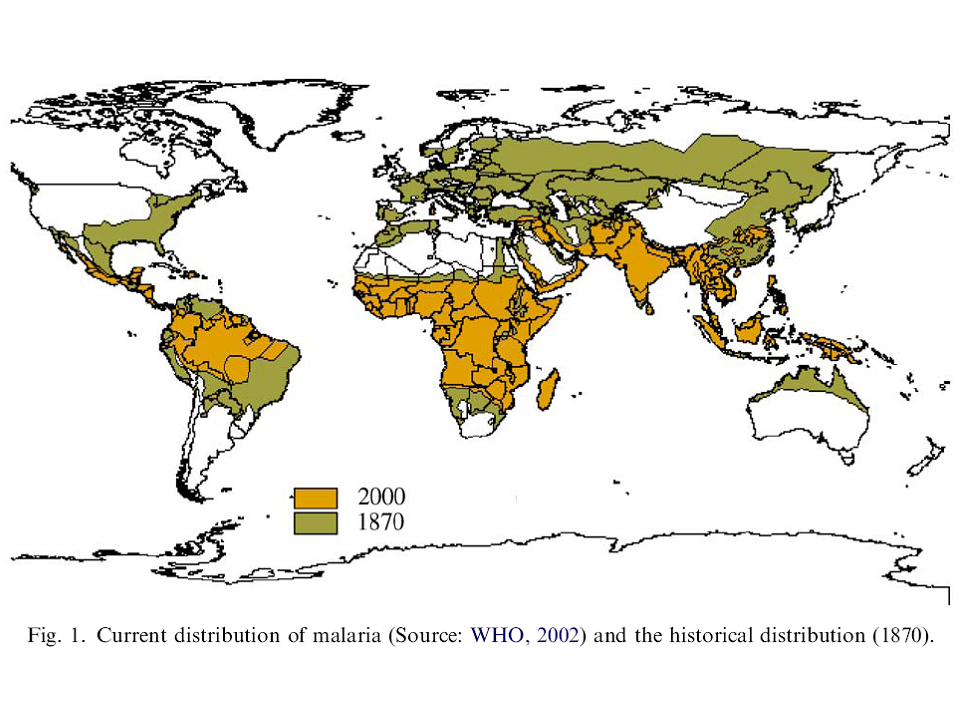
 | Van Lieshout et al. 2004 (fig. 1) | malaria distribution | global | - | - | 1870, 2000 | - | 1870s: peak of global malaria spread |
|---|
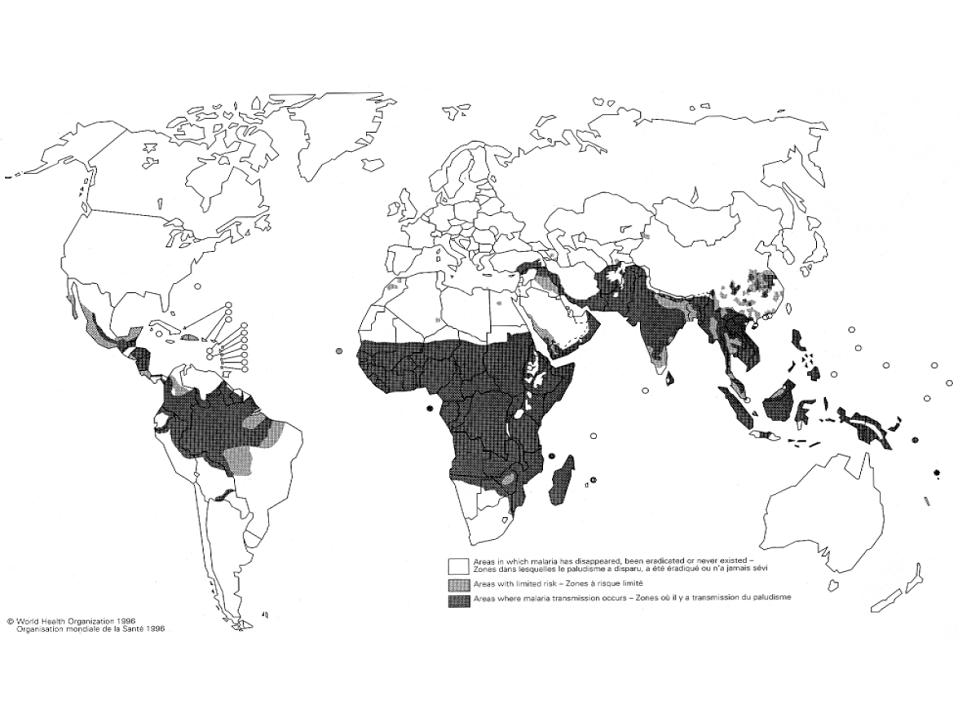
 | Who 1997a (fig. ) | status of malaria | world | - | - | 1994 | - | - |
|---|
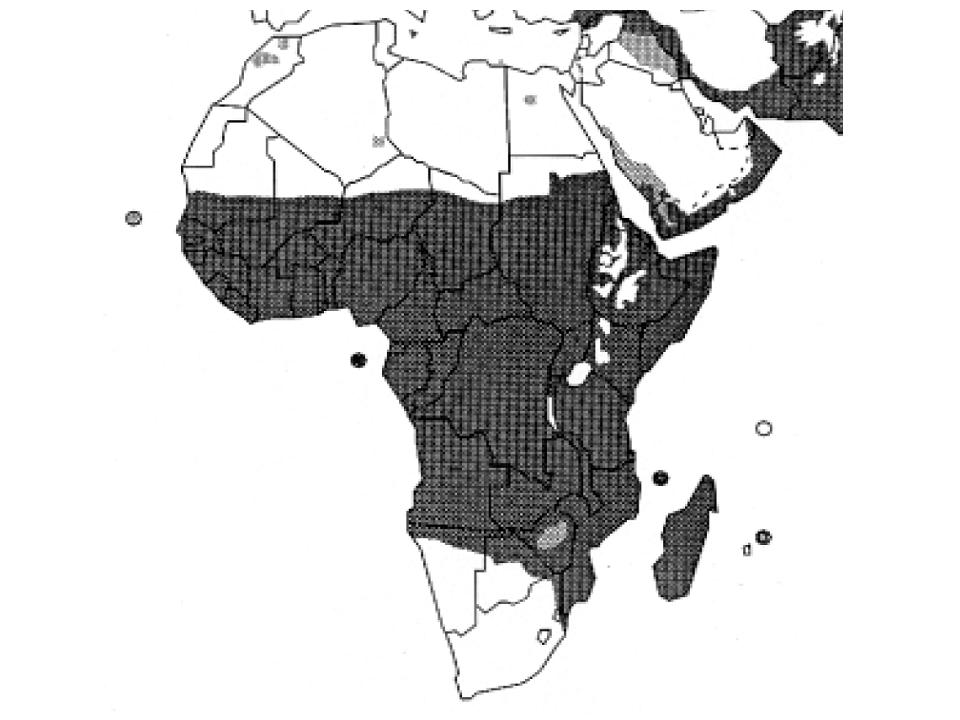
 | Who 1997a (fig. Africa) | status of malaria | Africa | - | - | 1994 | - | - |
|---|
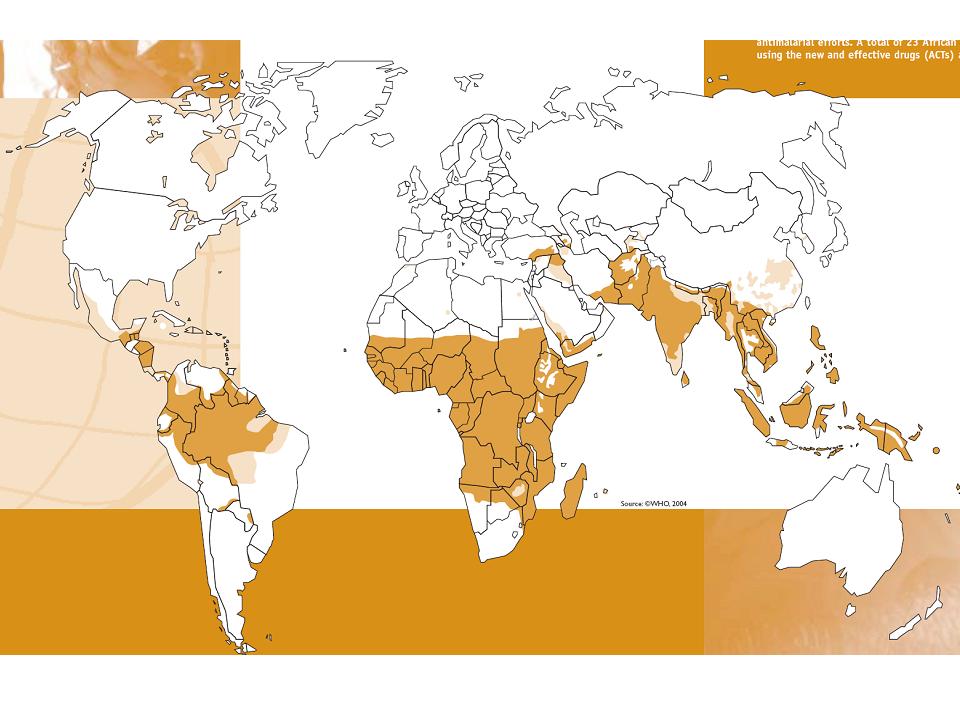
 | Who 2005 (fig. ) | malaria (risk) areas | world | - | - | 2004 | - | - |
|---|
 | Who 2005 (fig. Africa) | malaria (risk) areas | Africa | - | - | 2004 | - | - |
|---|
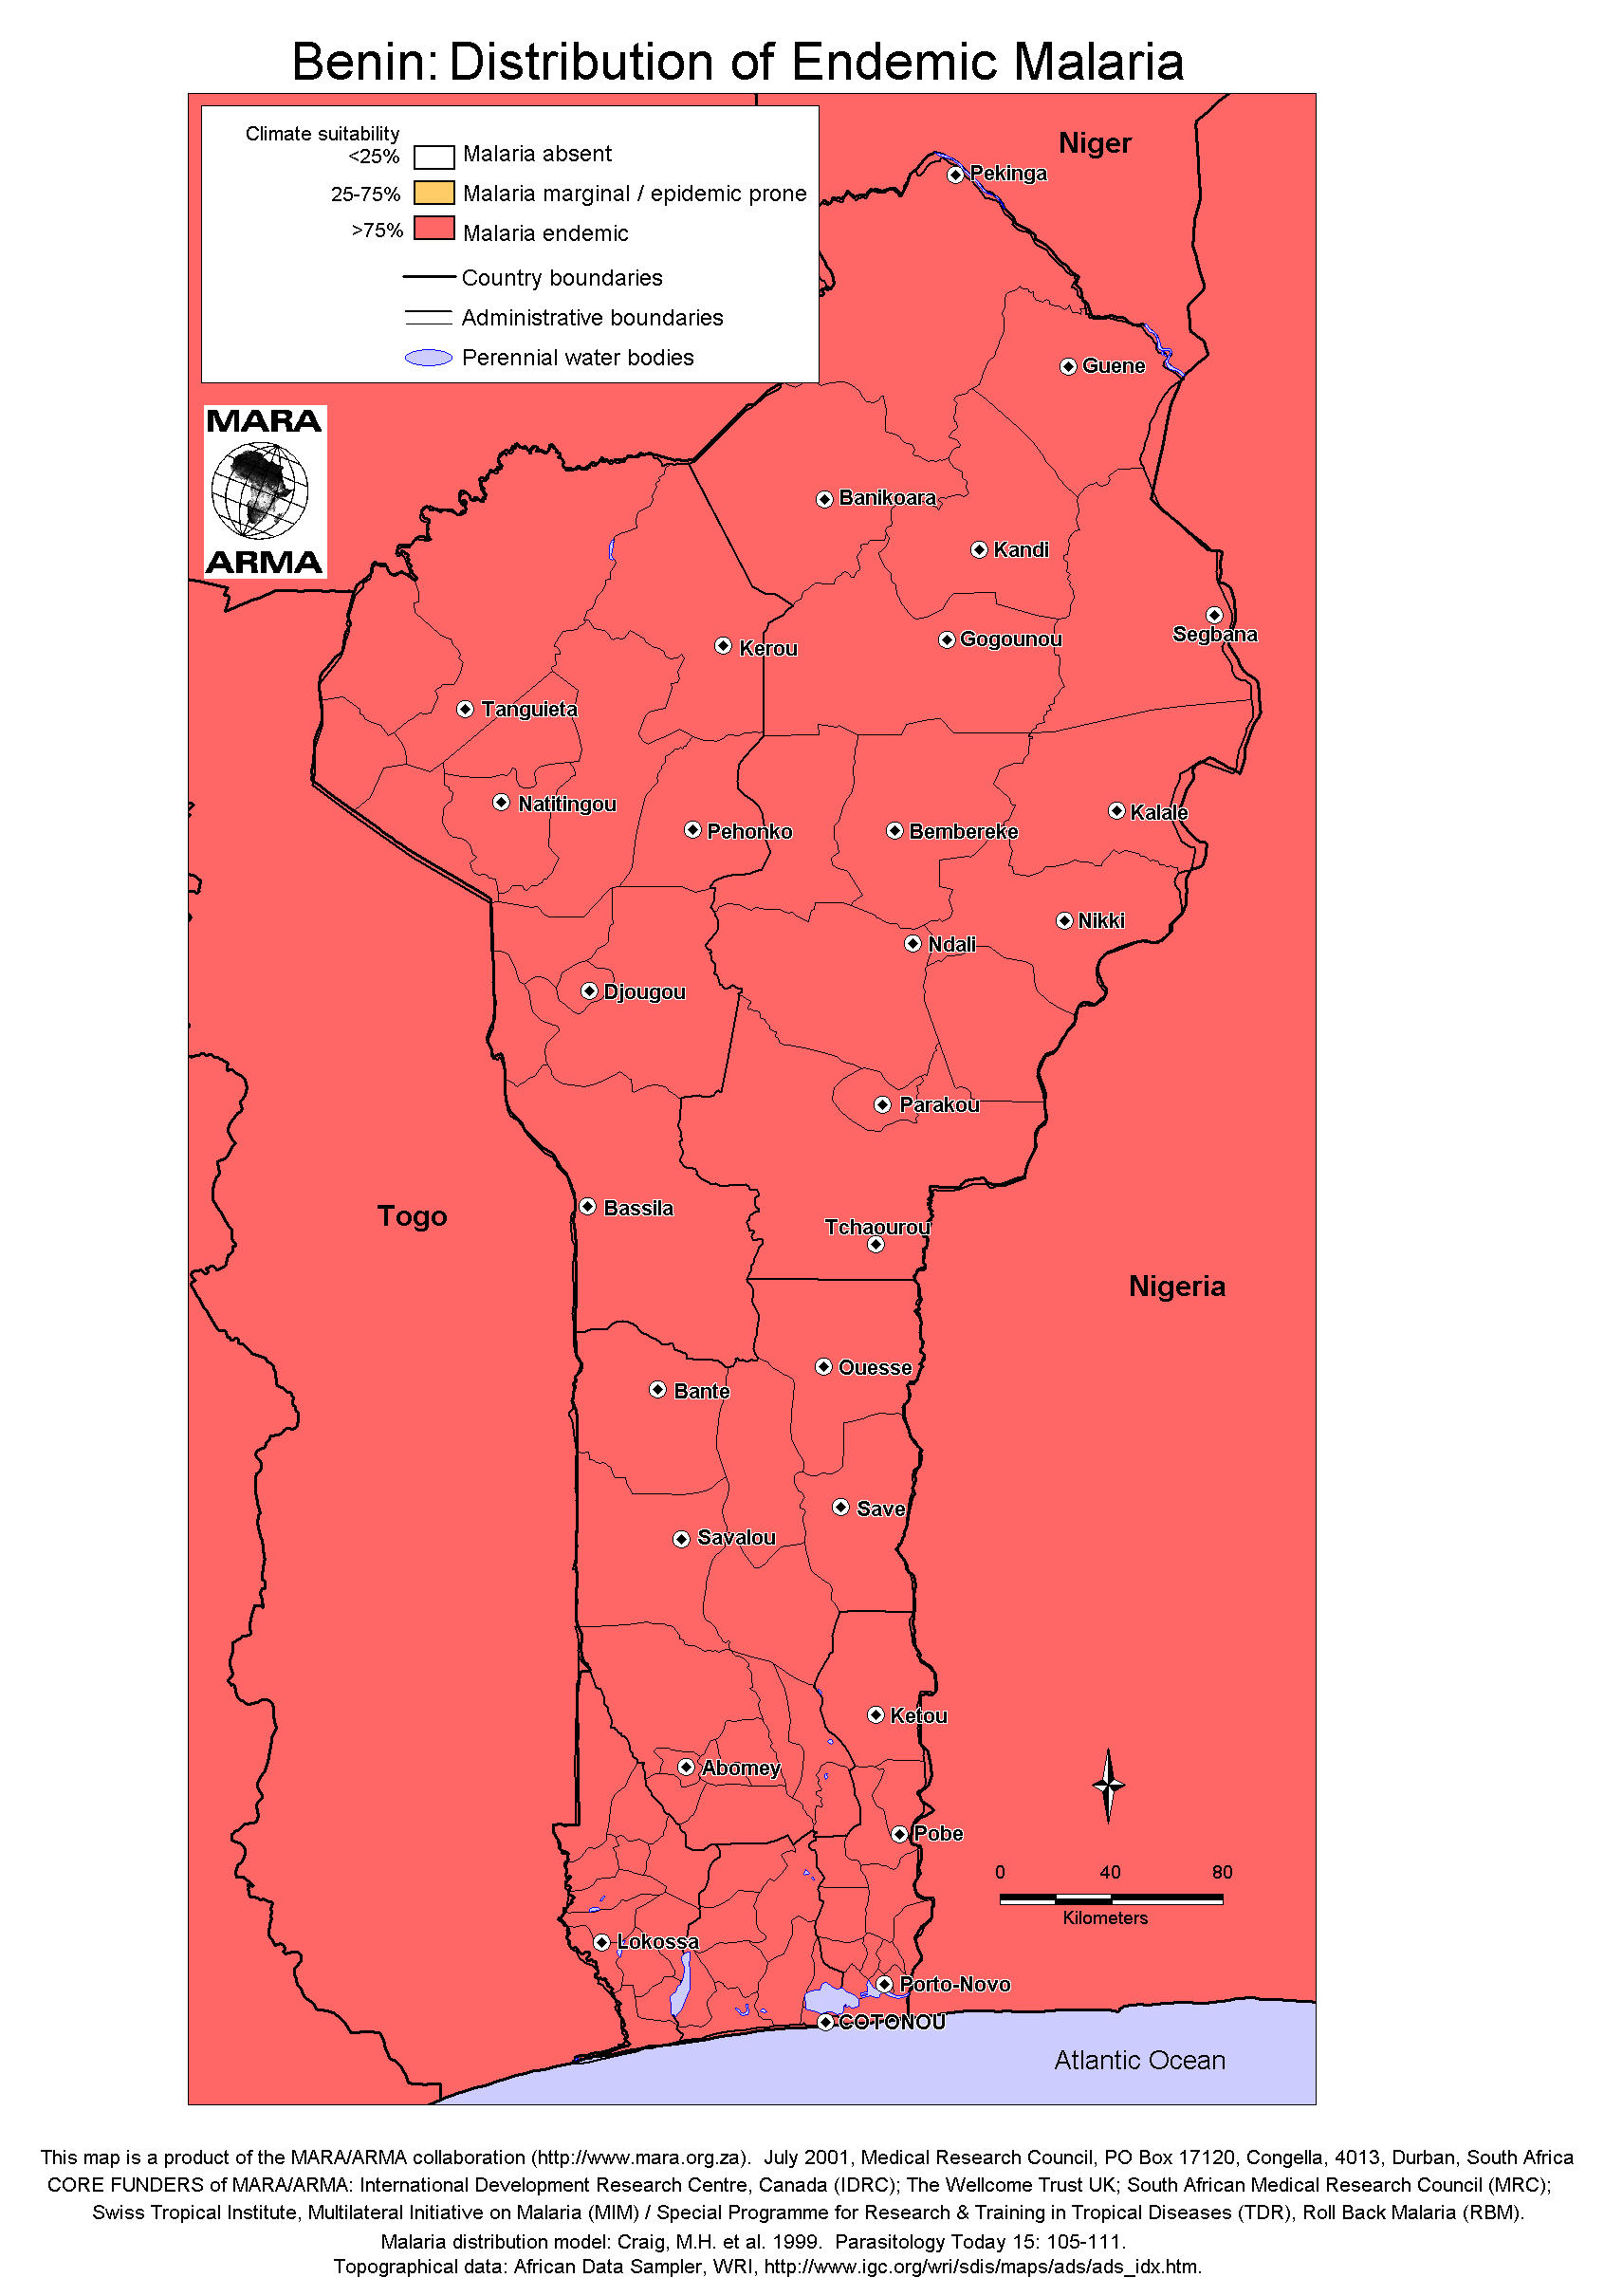
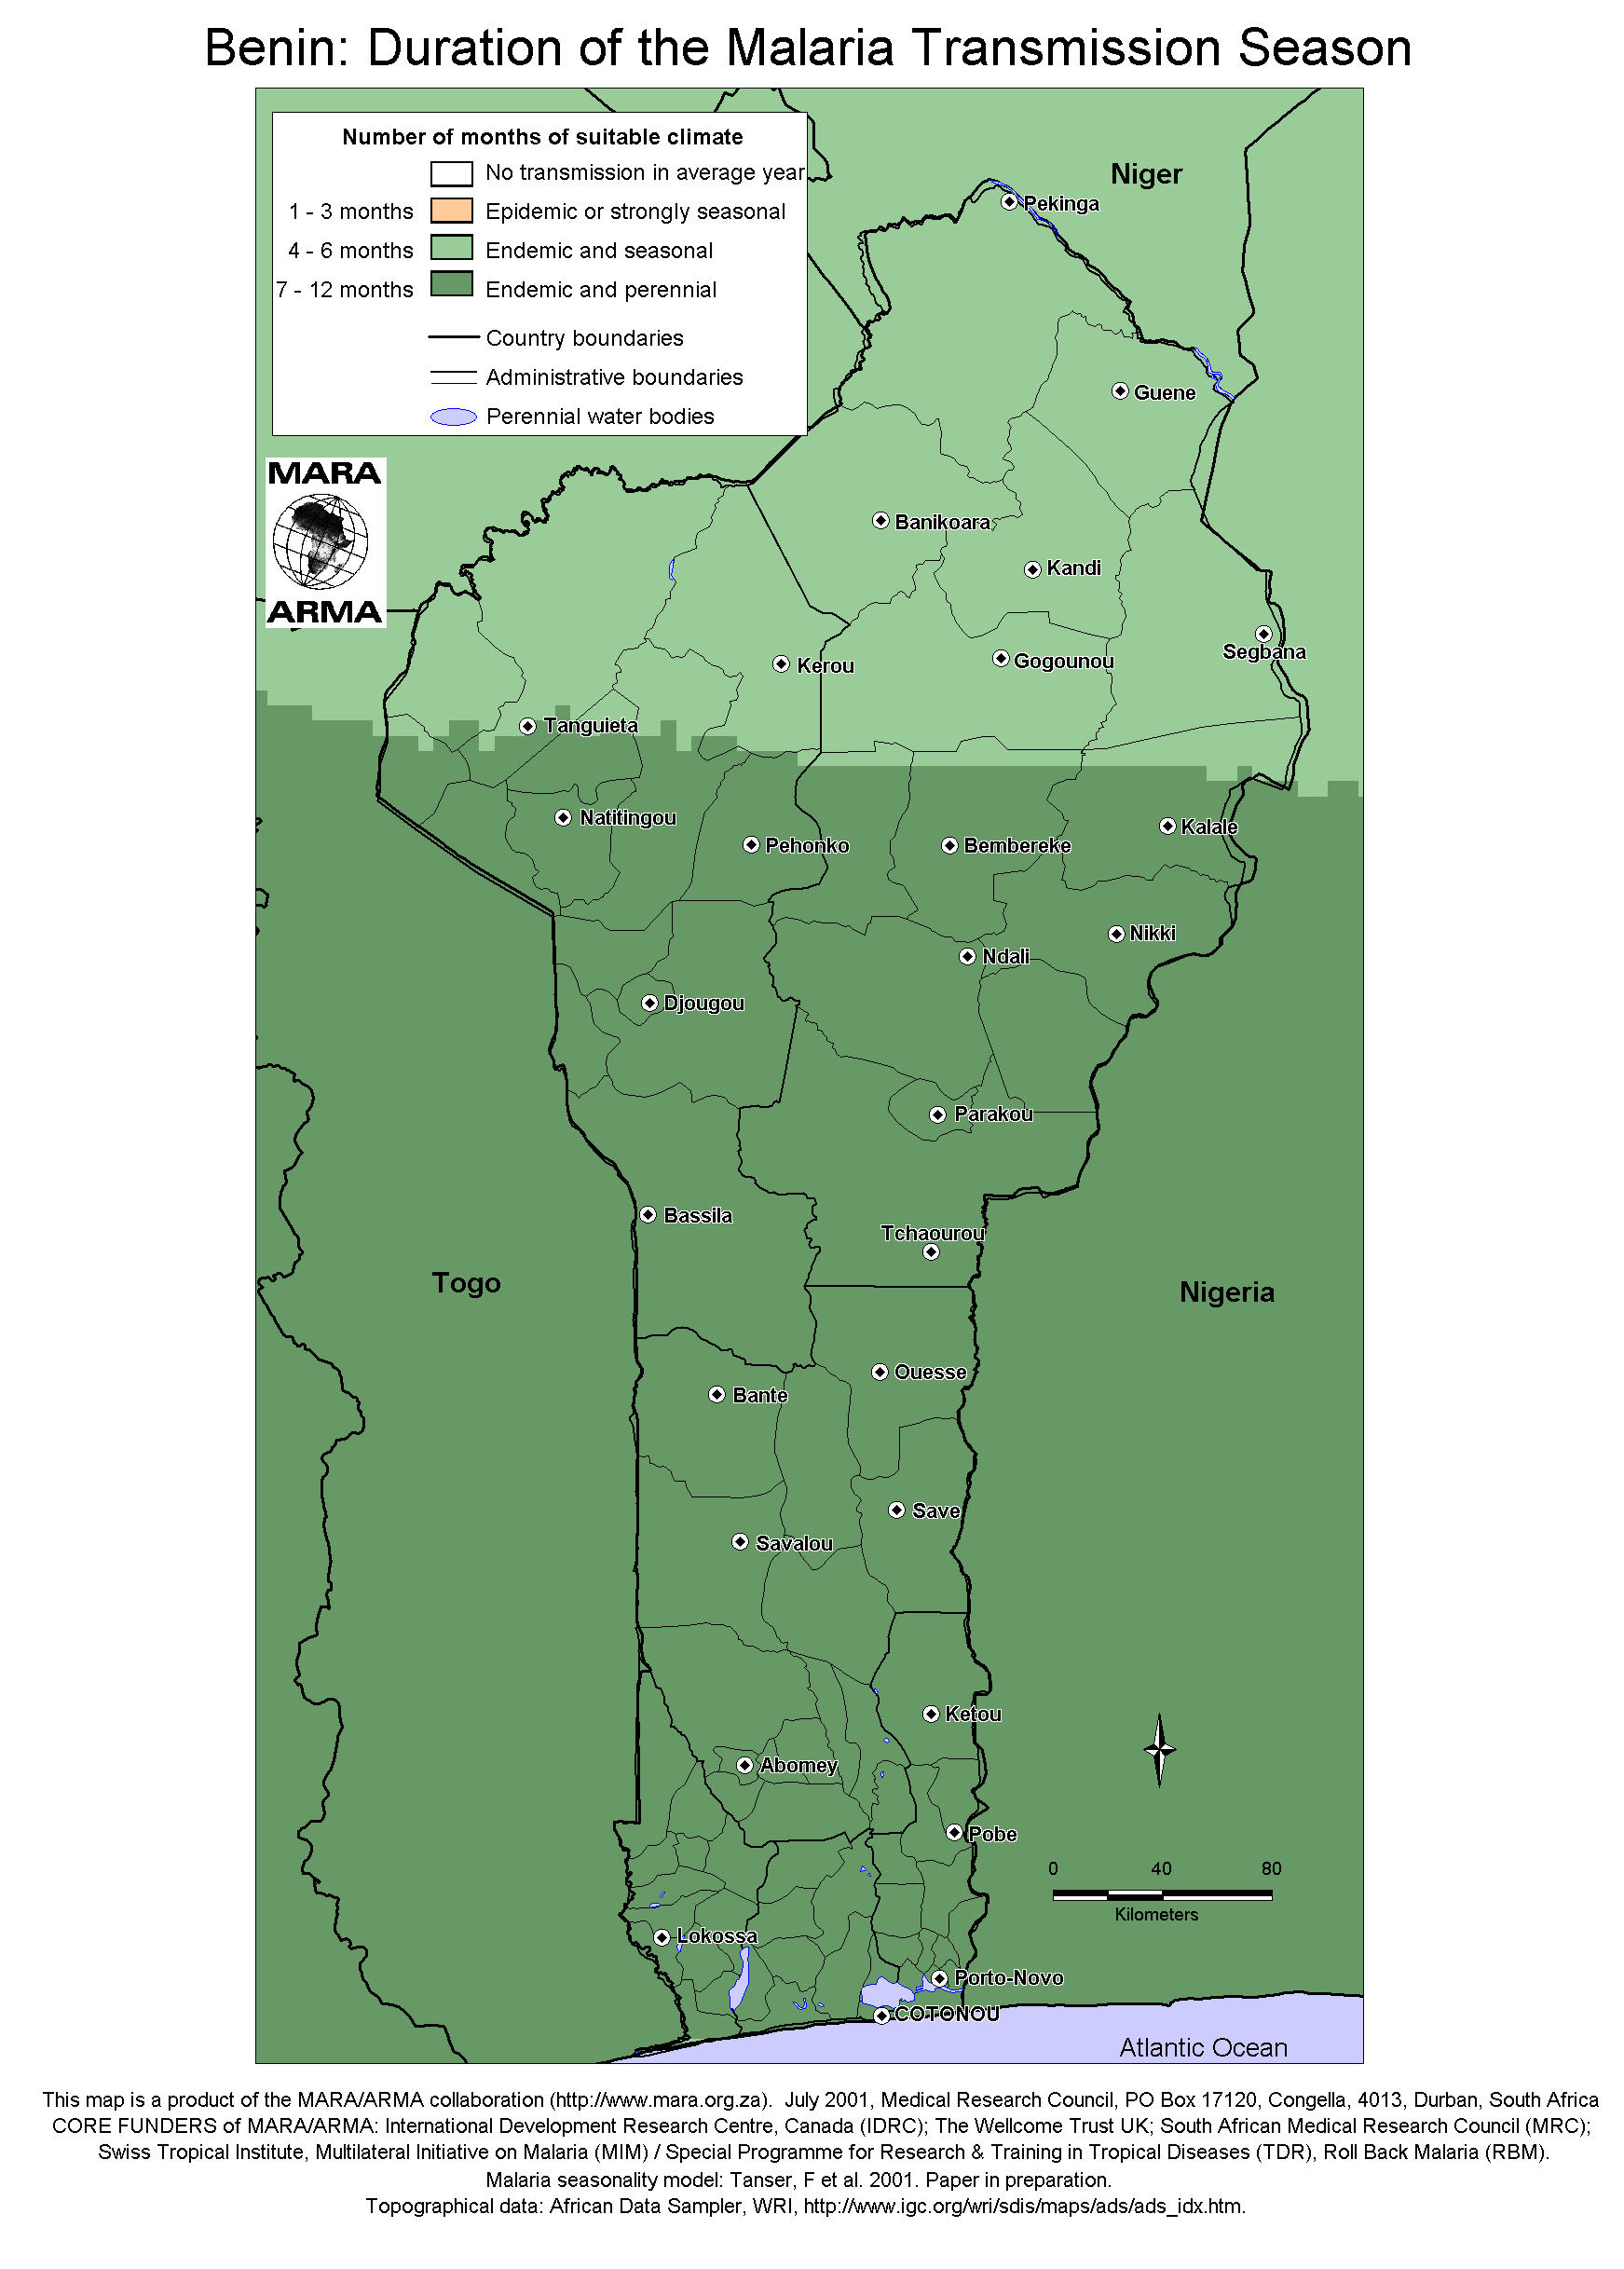
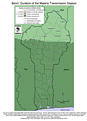
 | www.mara.org.za (BenDistribution) | distribution of endemic malaria | Benin | - | - | - | - | derived from MDM results |
|---|
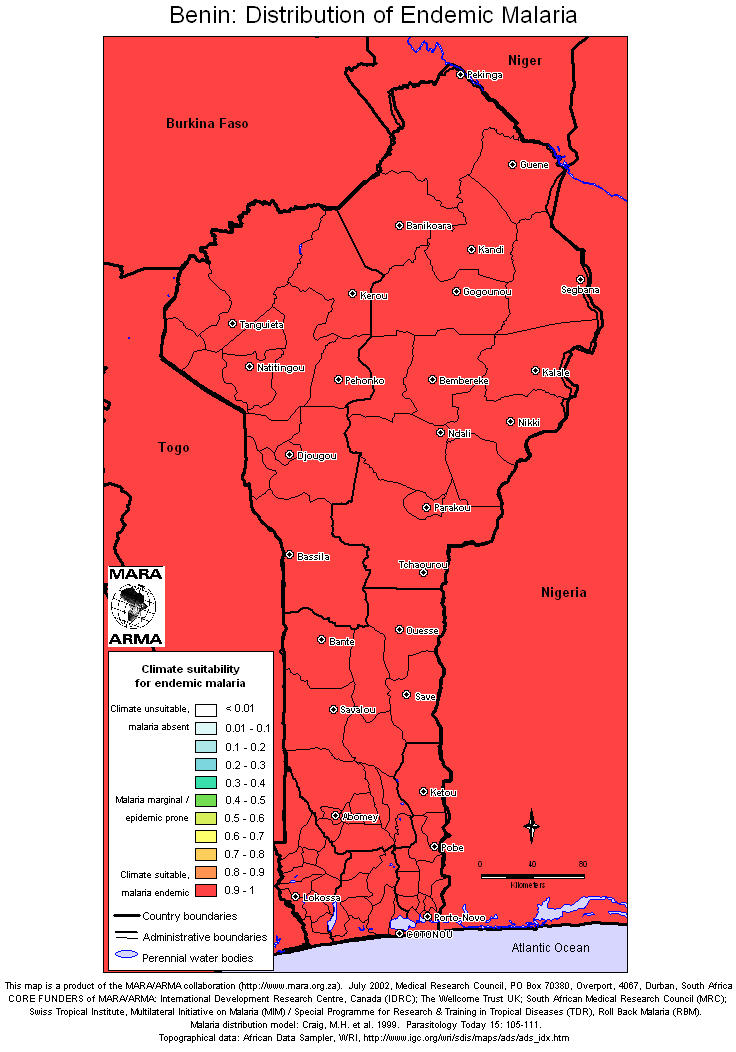
 | www.mara.org.za (BenDistributionGrad) | distribution of endemic malaria | Benin | - | - | - | - | MDM results |
|---|
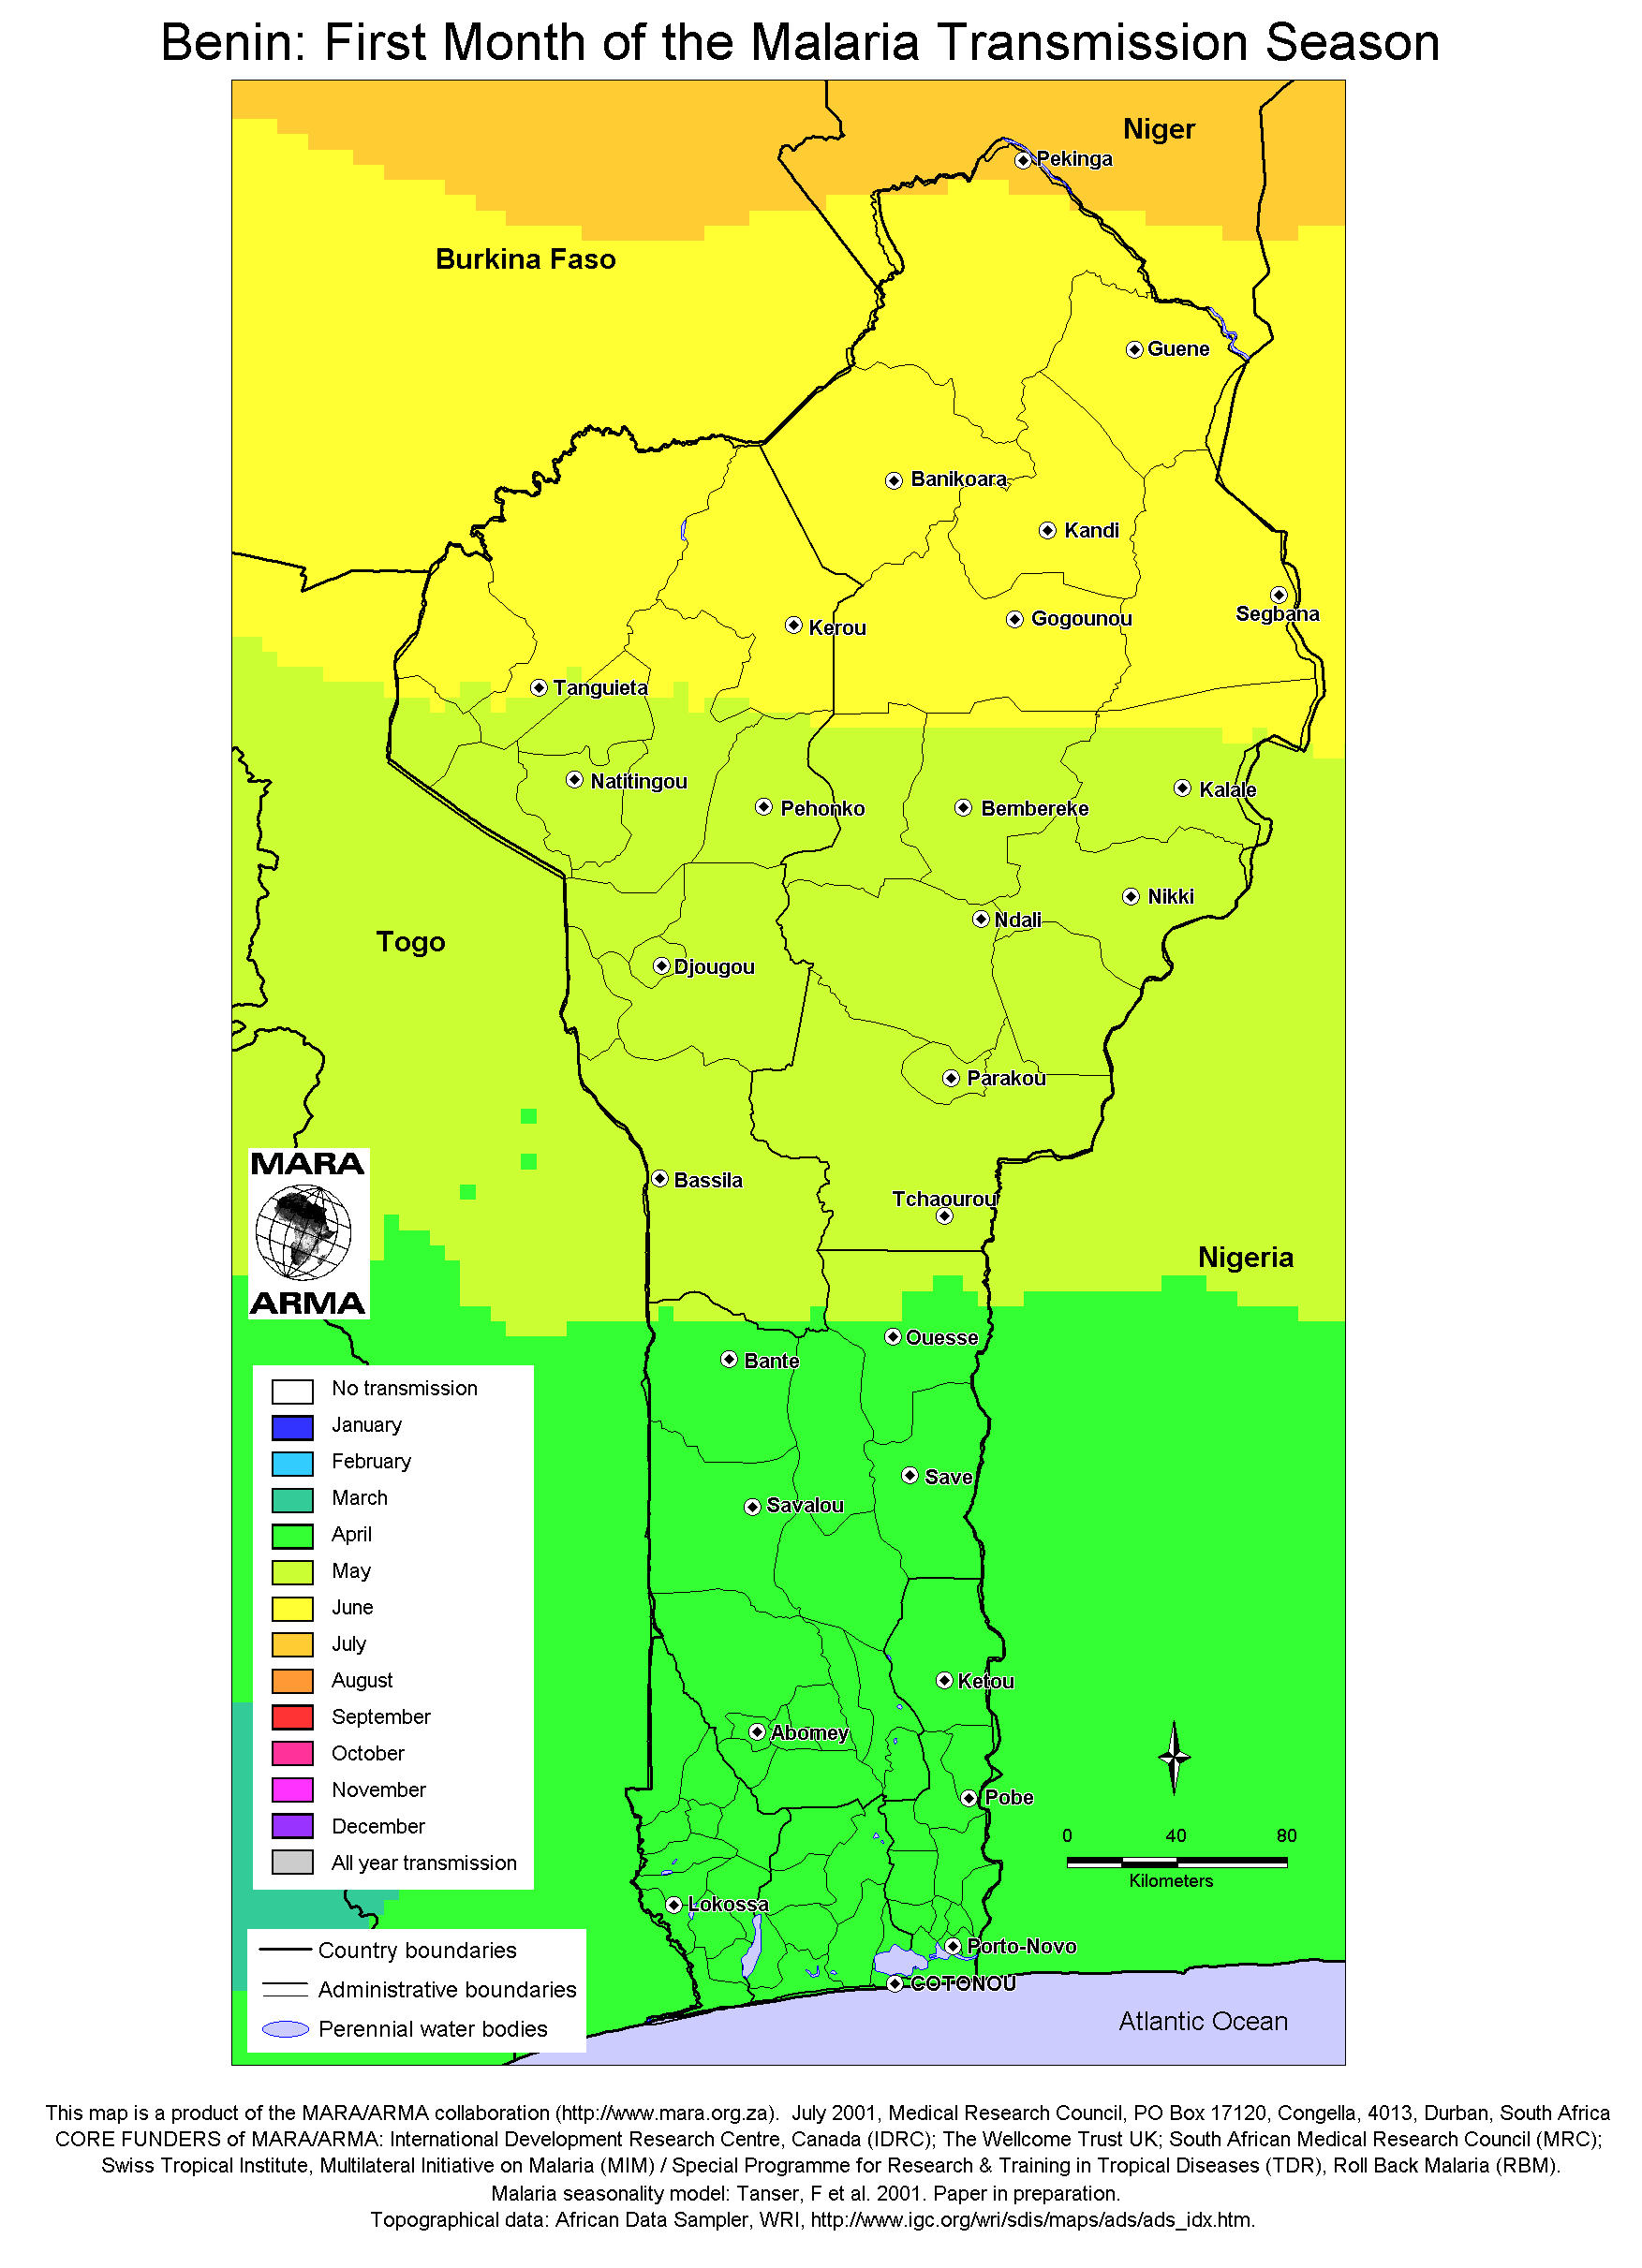
 | www.mara.org.za (BenFirstMonth) | first month of the malaria season | Benin | - | - | - | - | MSM results |
|---|
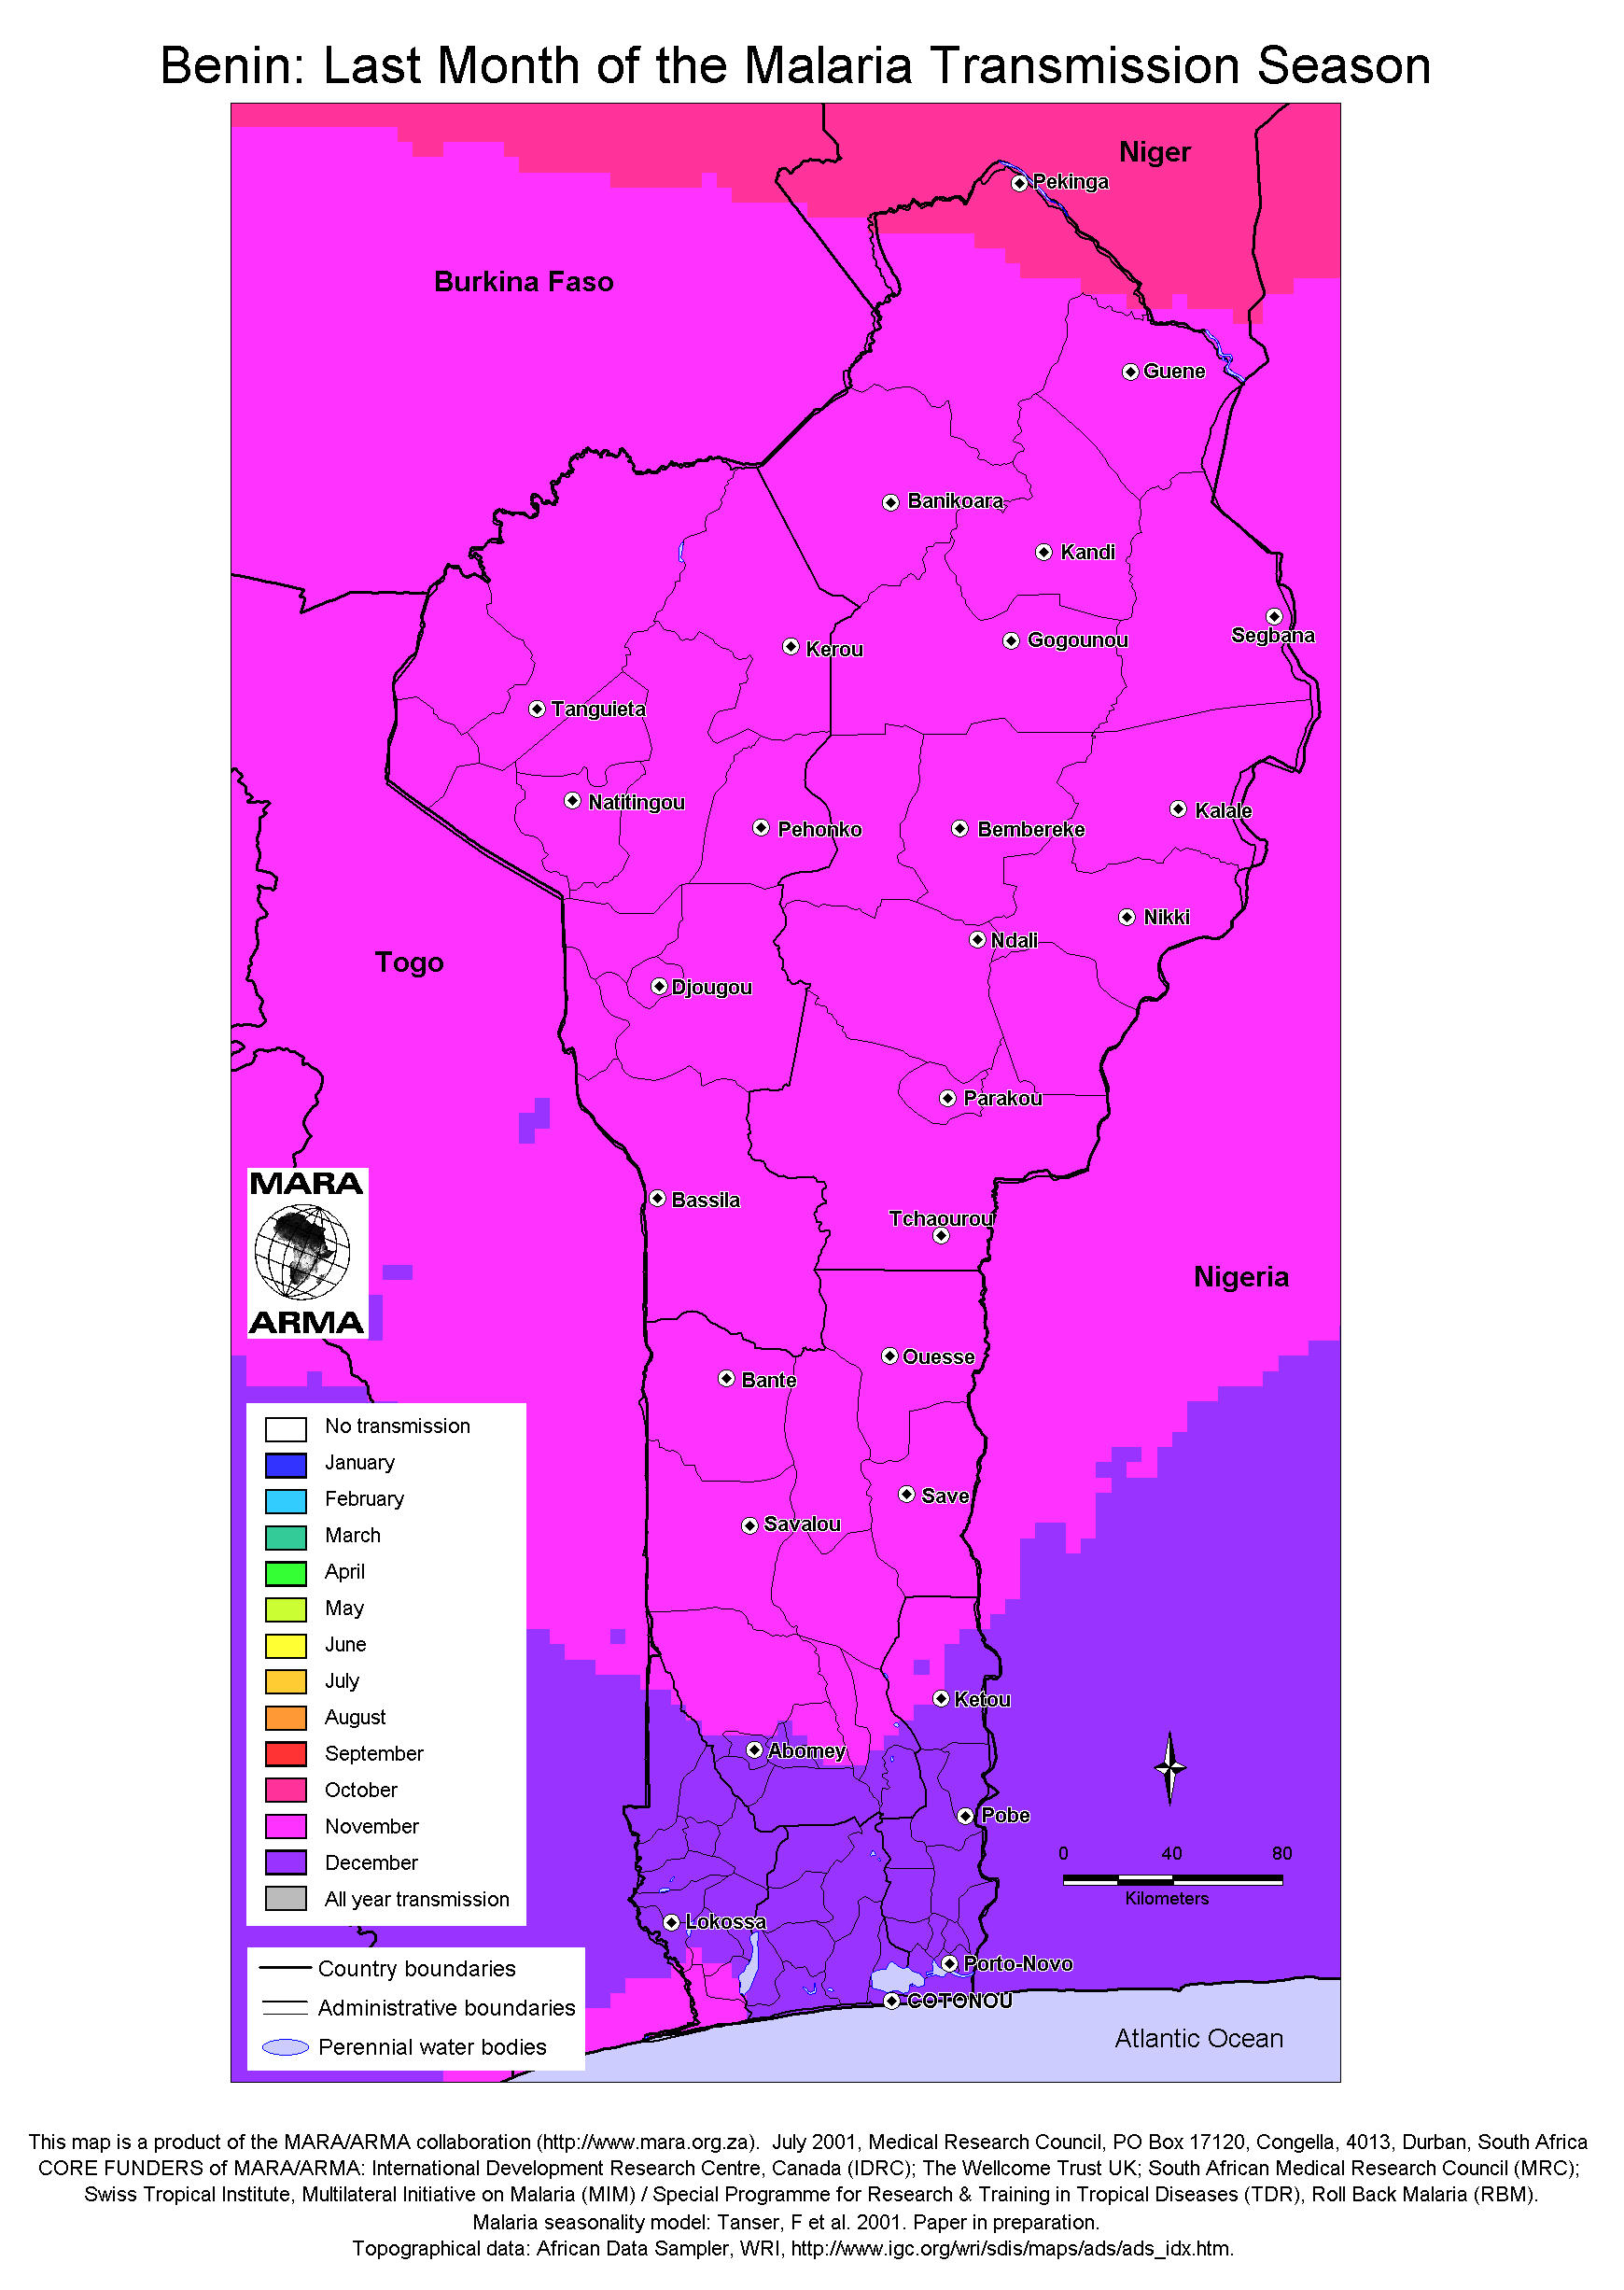
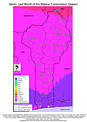 | www.mara.org.za (BenLastMonth) | last month of the malaria season | Benin | - | - | - | - | MSM results |
|---|
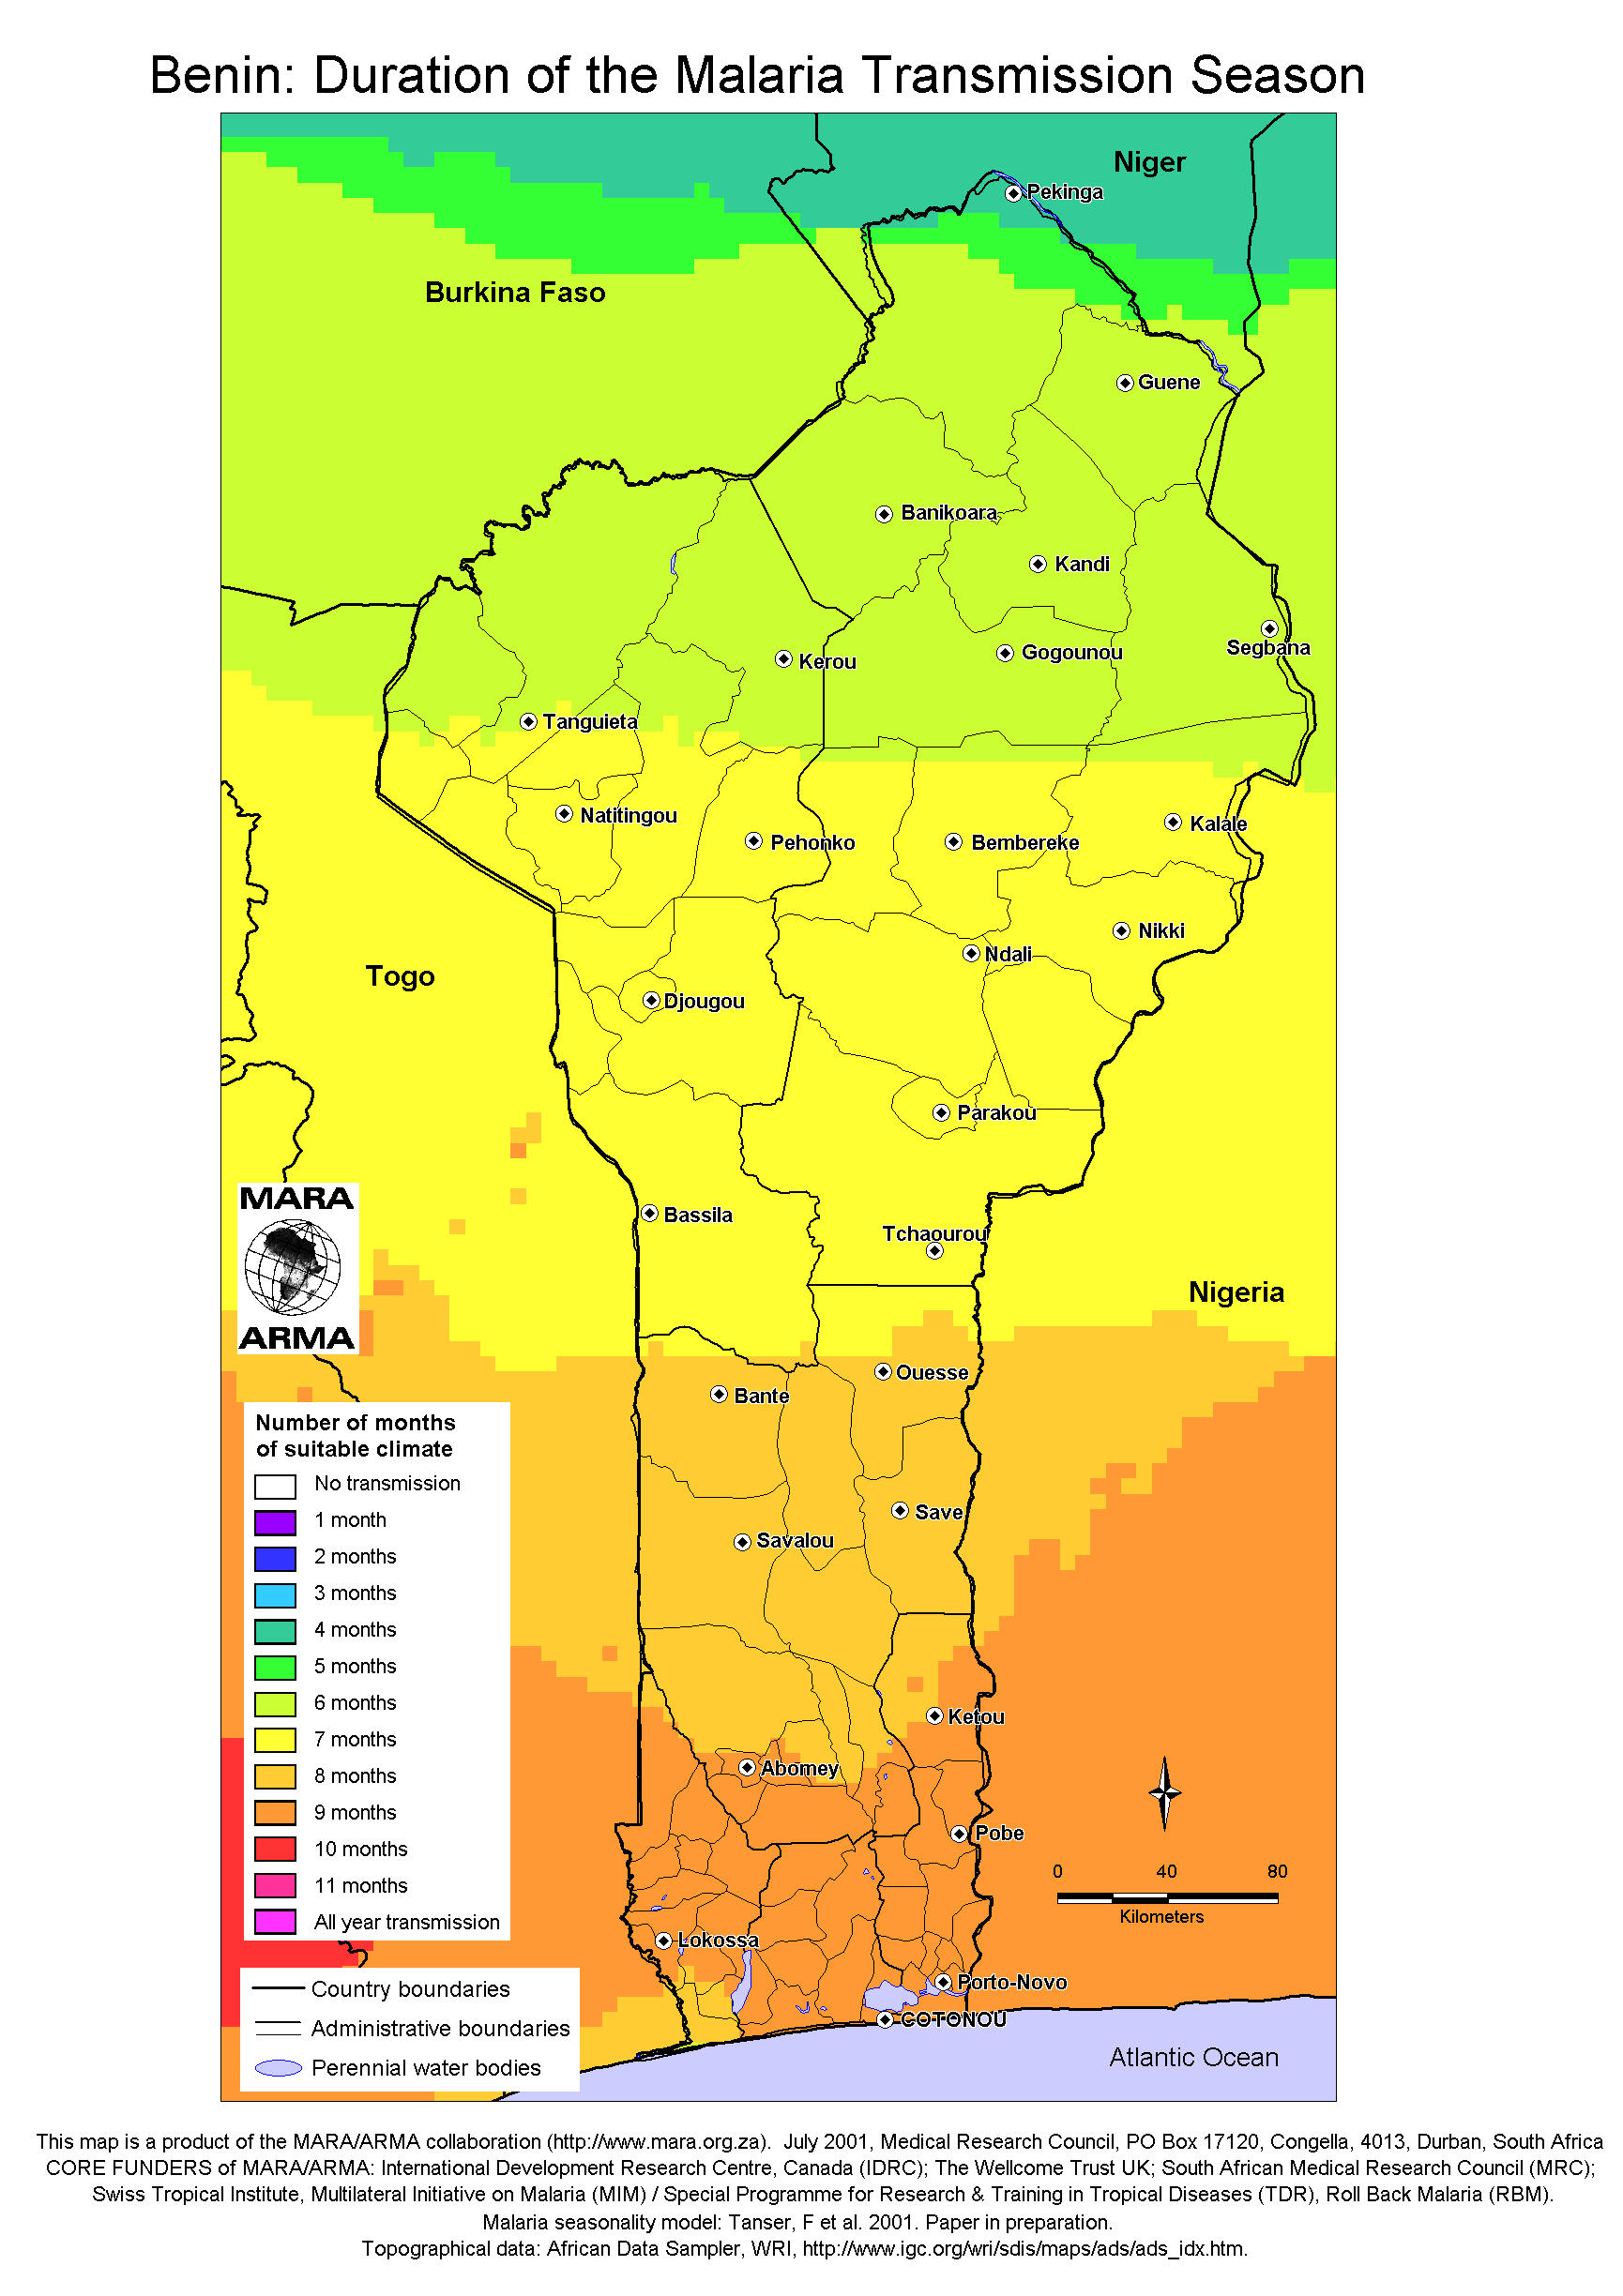
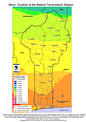 | www.mara.org.za (BenMonthsRisk) | duration of the malaria season | Benin | - | - | - | - | MSM results |
|---|
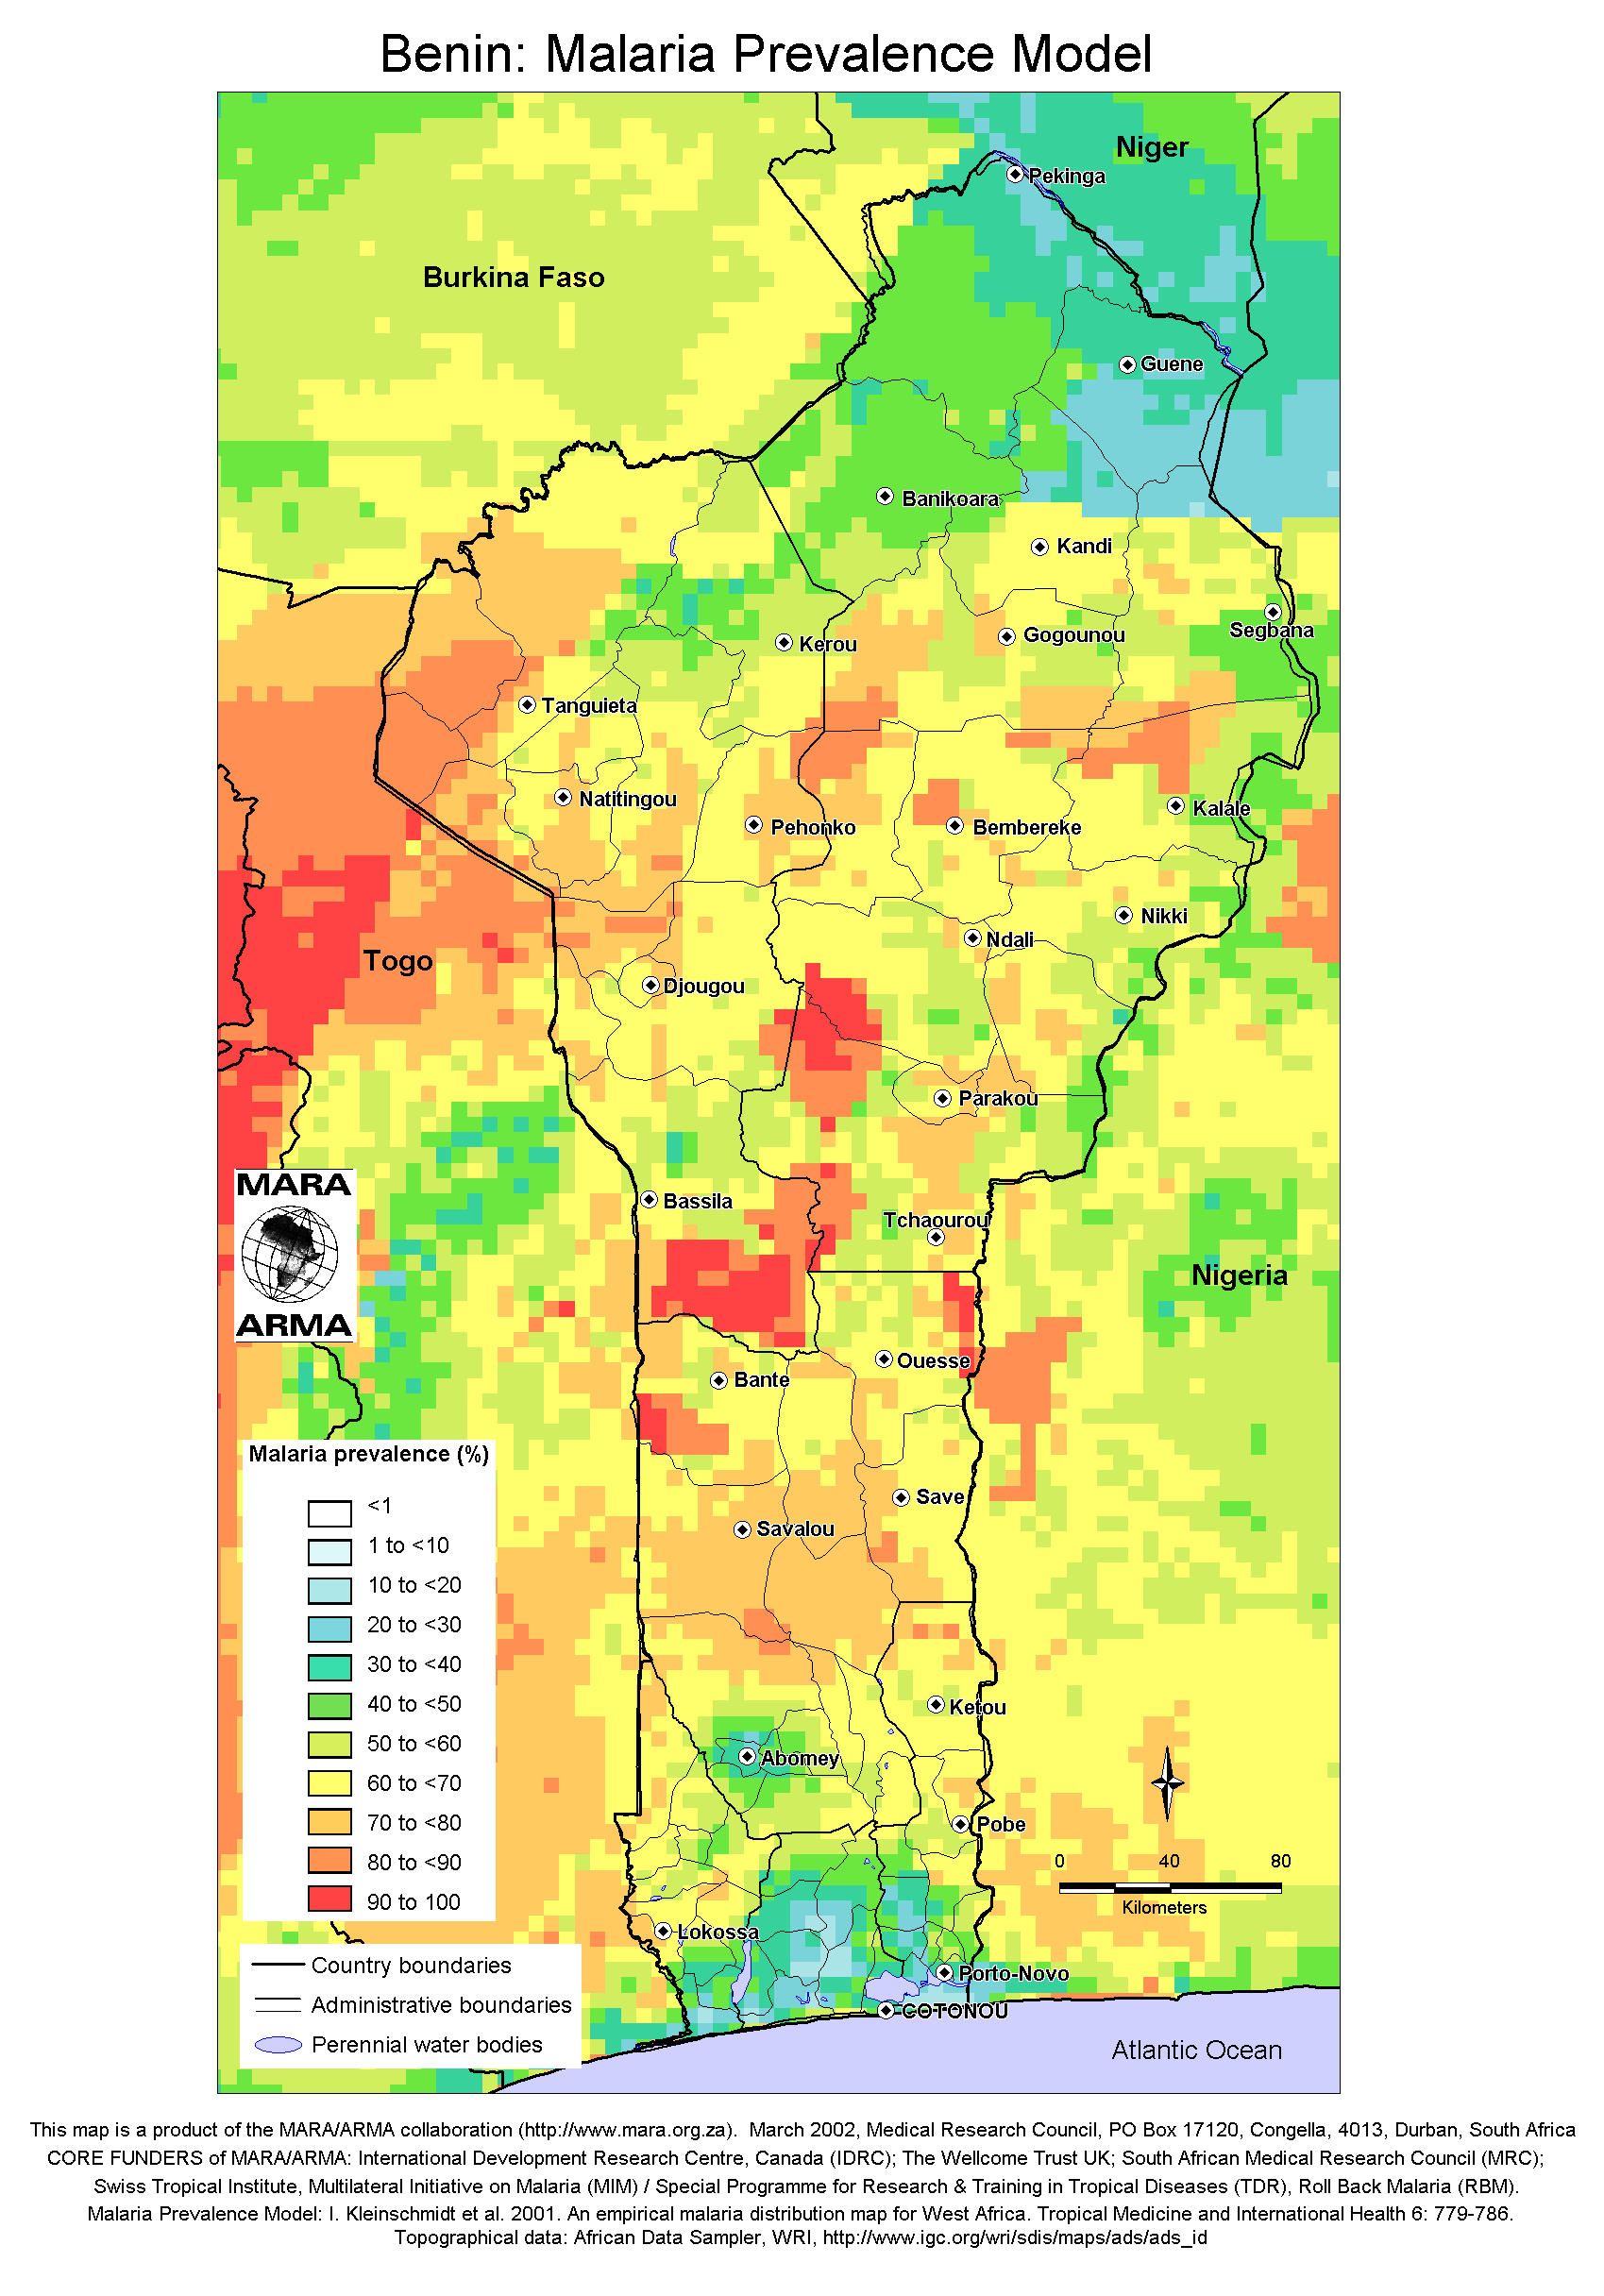
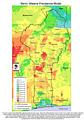 | www.mara.org.za (BenPrevModel) | calculated PR | Benin | - | - | - | - | MARA prevalence model |
|---|
 | www.mara.org.za (BenSeasonality) | malaria seasonality | Benin | - | - | - | - | MSM results |
|---|
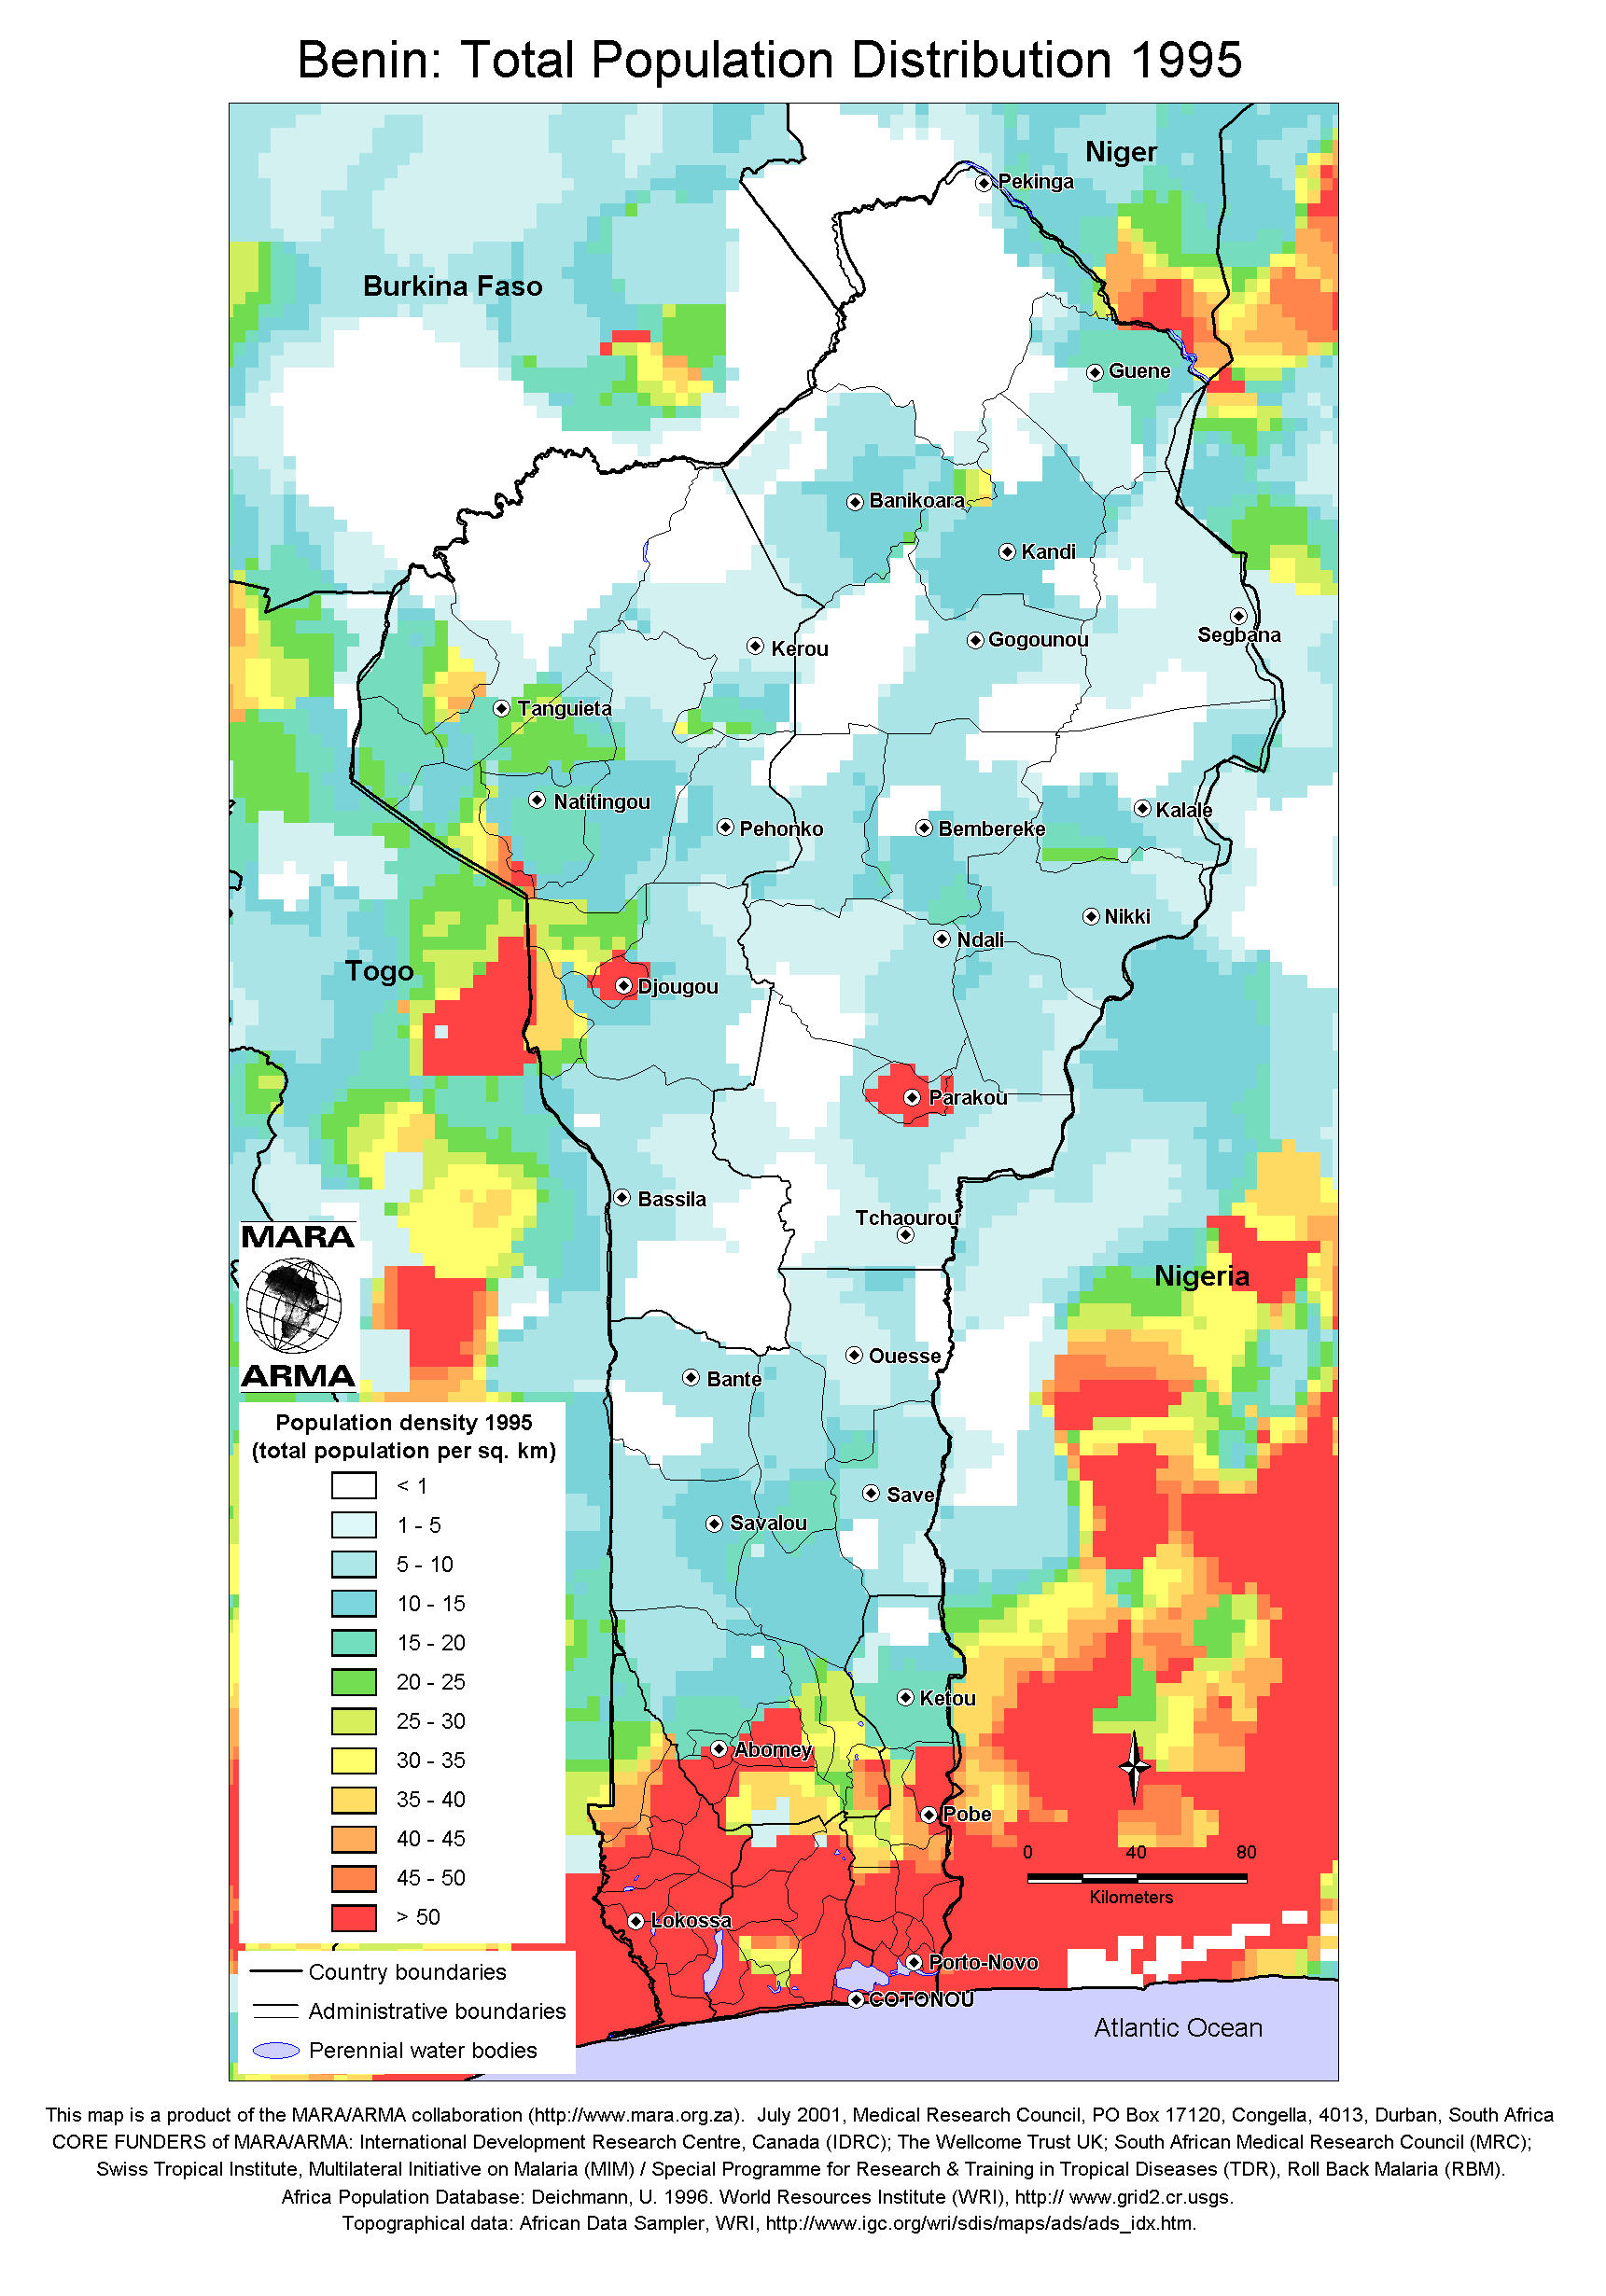
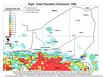
 | www.mara.org.za (BenTotPopulation95) | population density | Benin | - | - | 1995 | - | - |
|---|
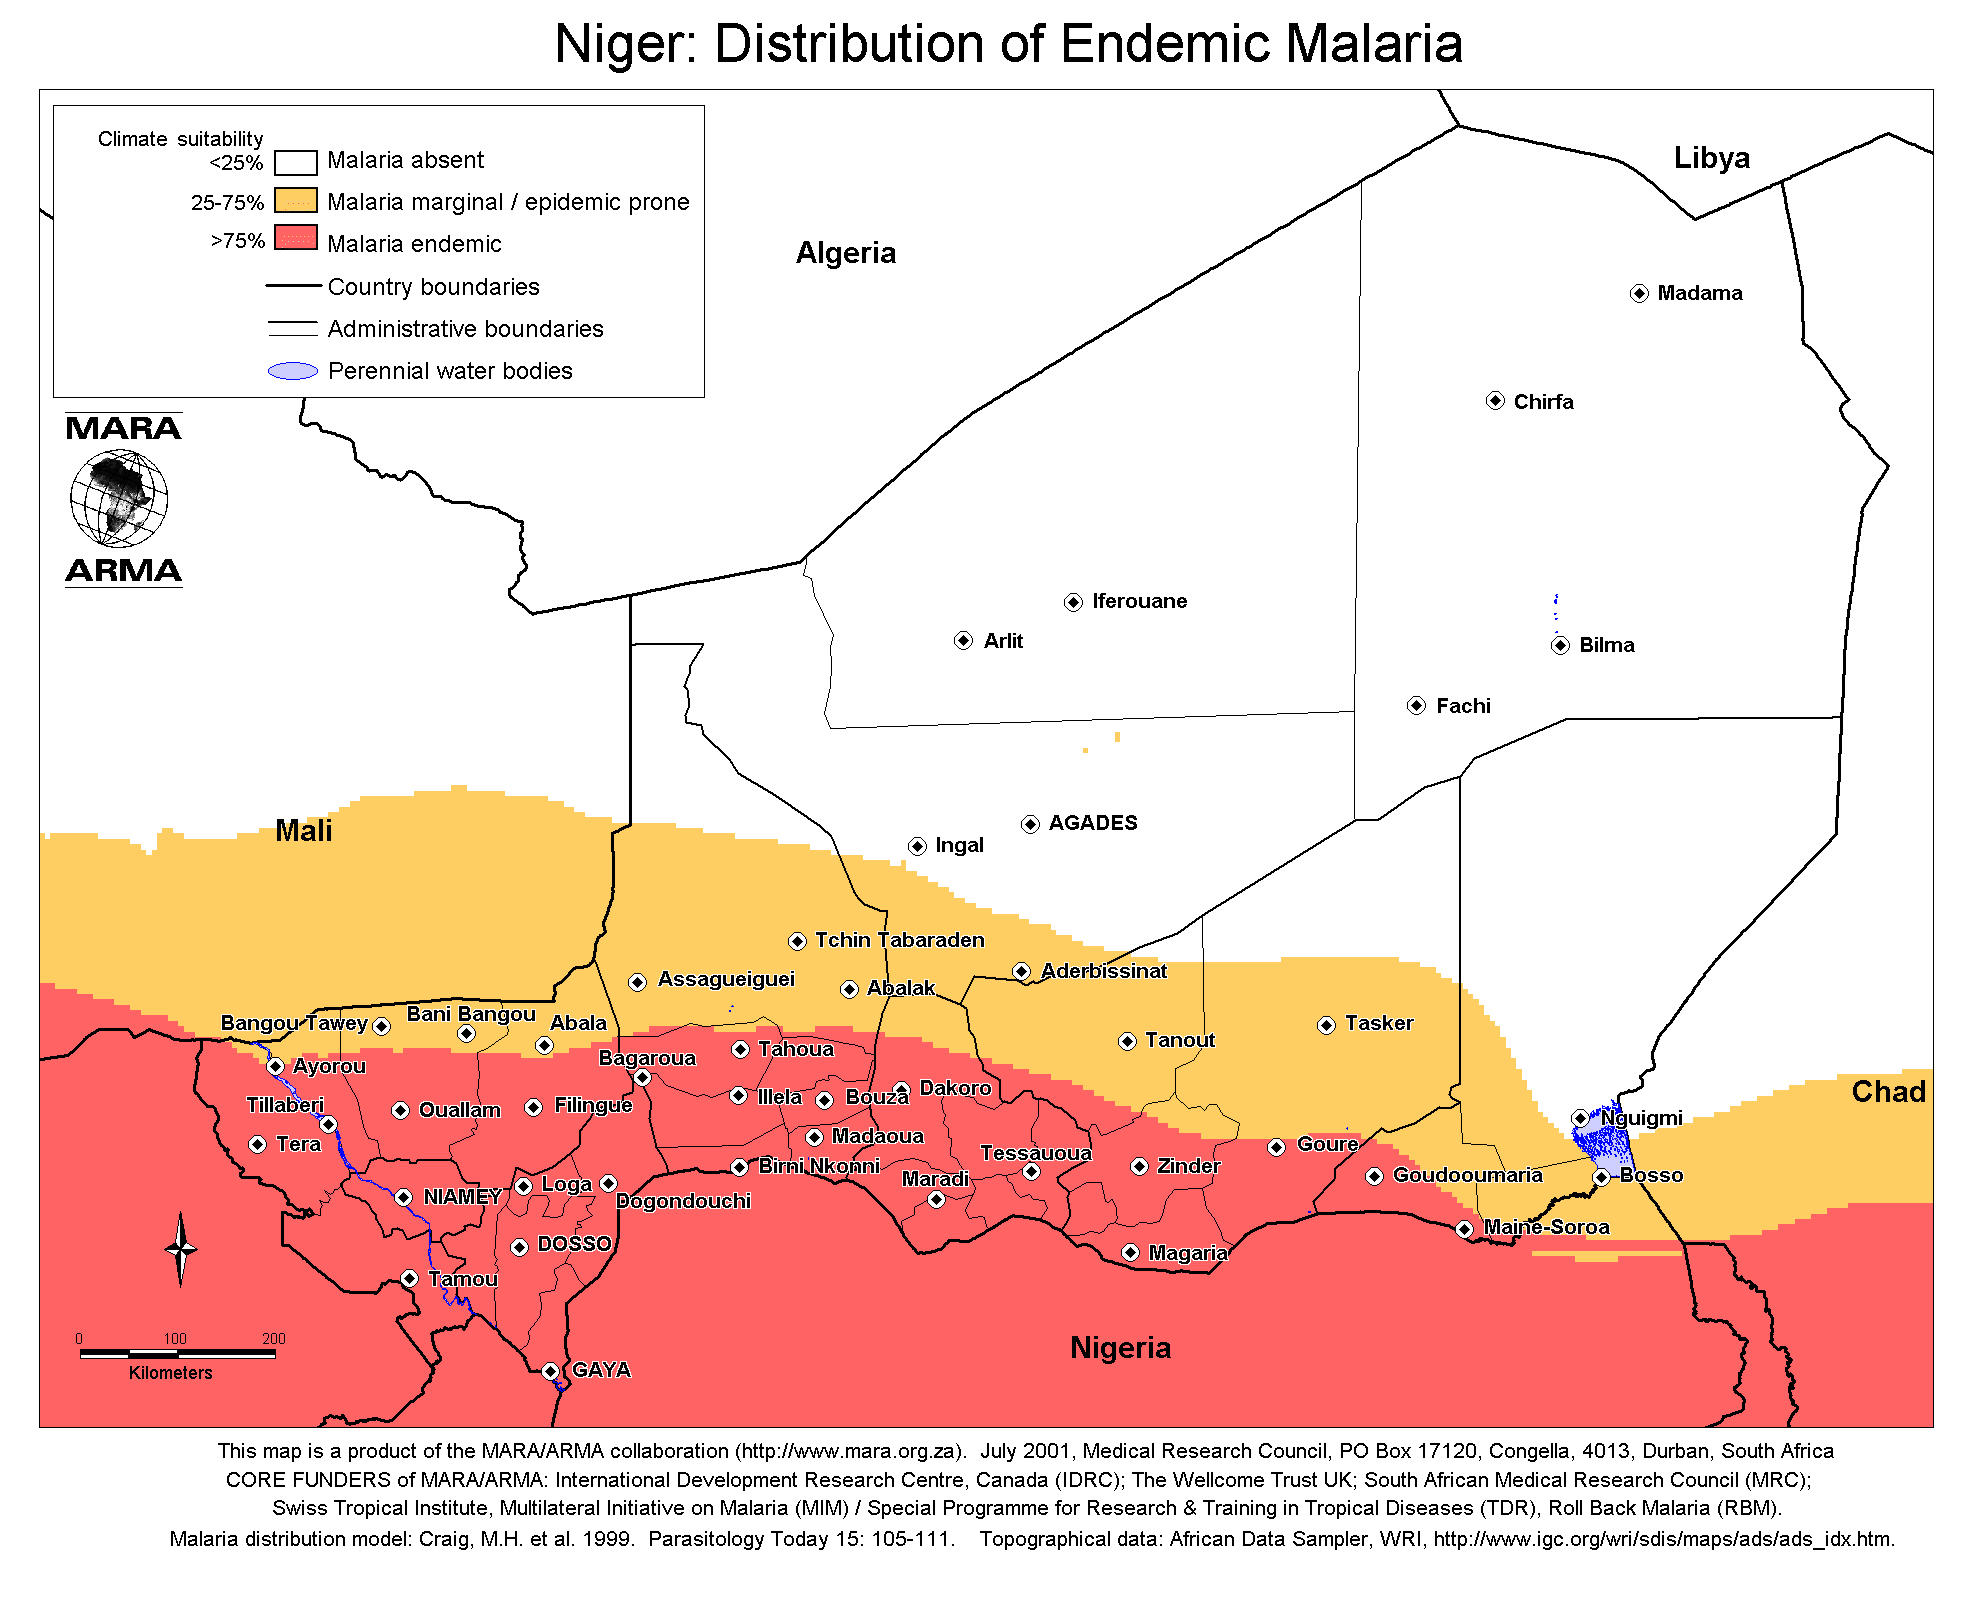
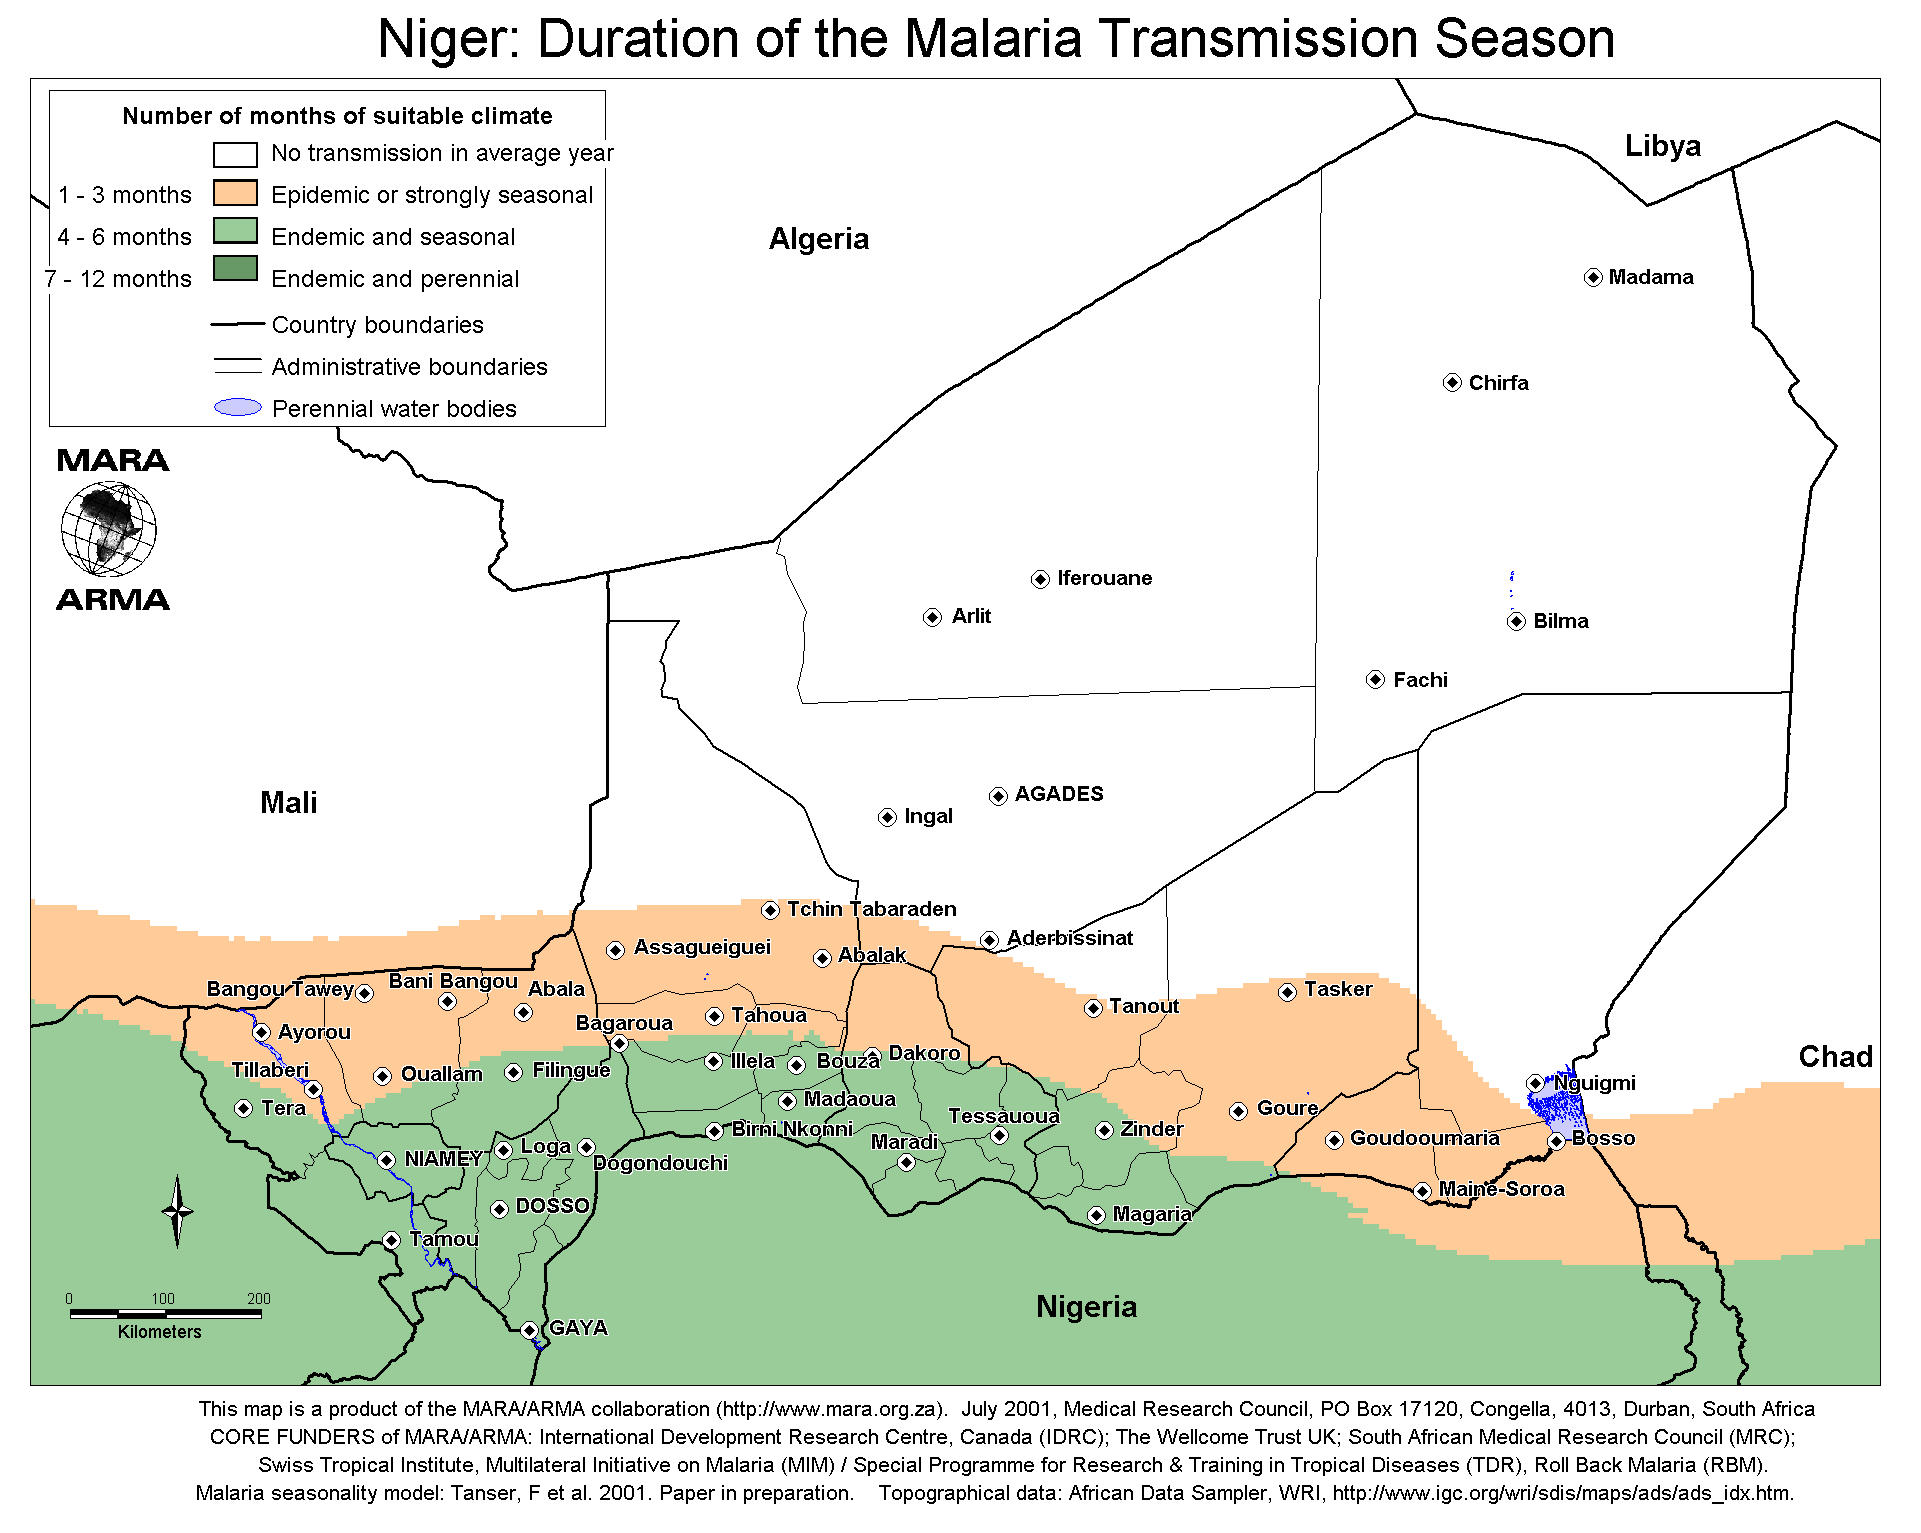
 | www.mara.org.za (NgrDistribution) | distribution of endemic malaria | Niger | - | - | - | - | derived from MDM results |
|---|
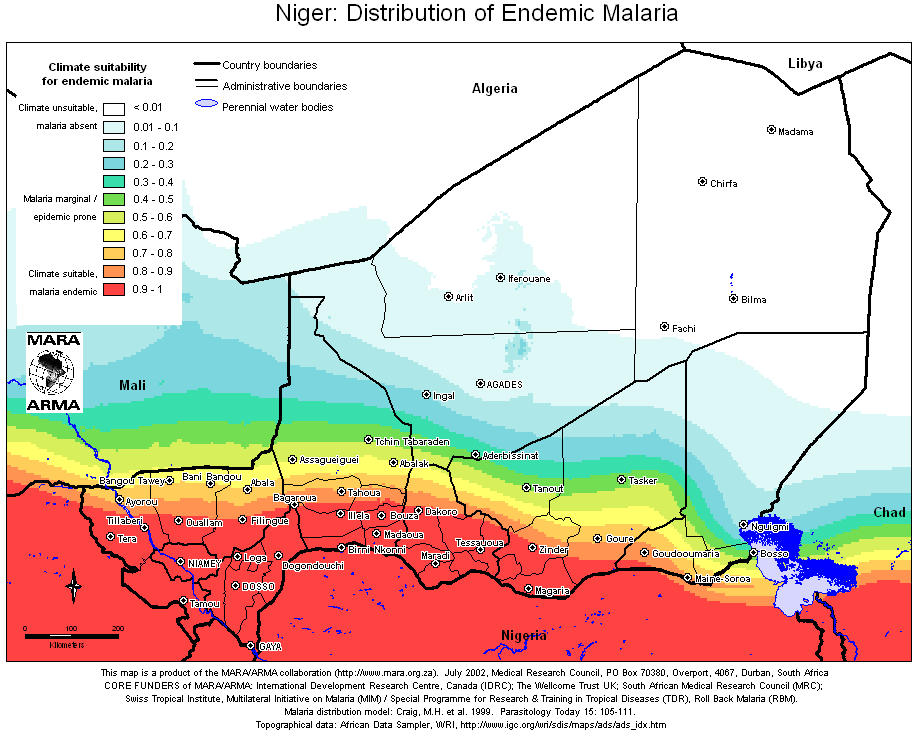
 | www.mara.org.za (NgrDistributionGrad) | distribution of endemic malaria | Niger | - | - | - | - | MDM results |
|---|
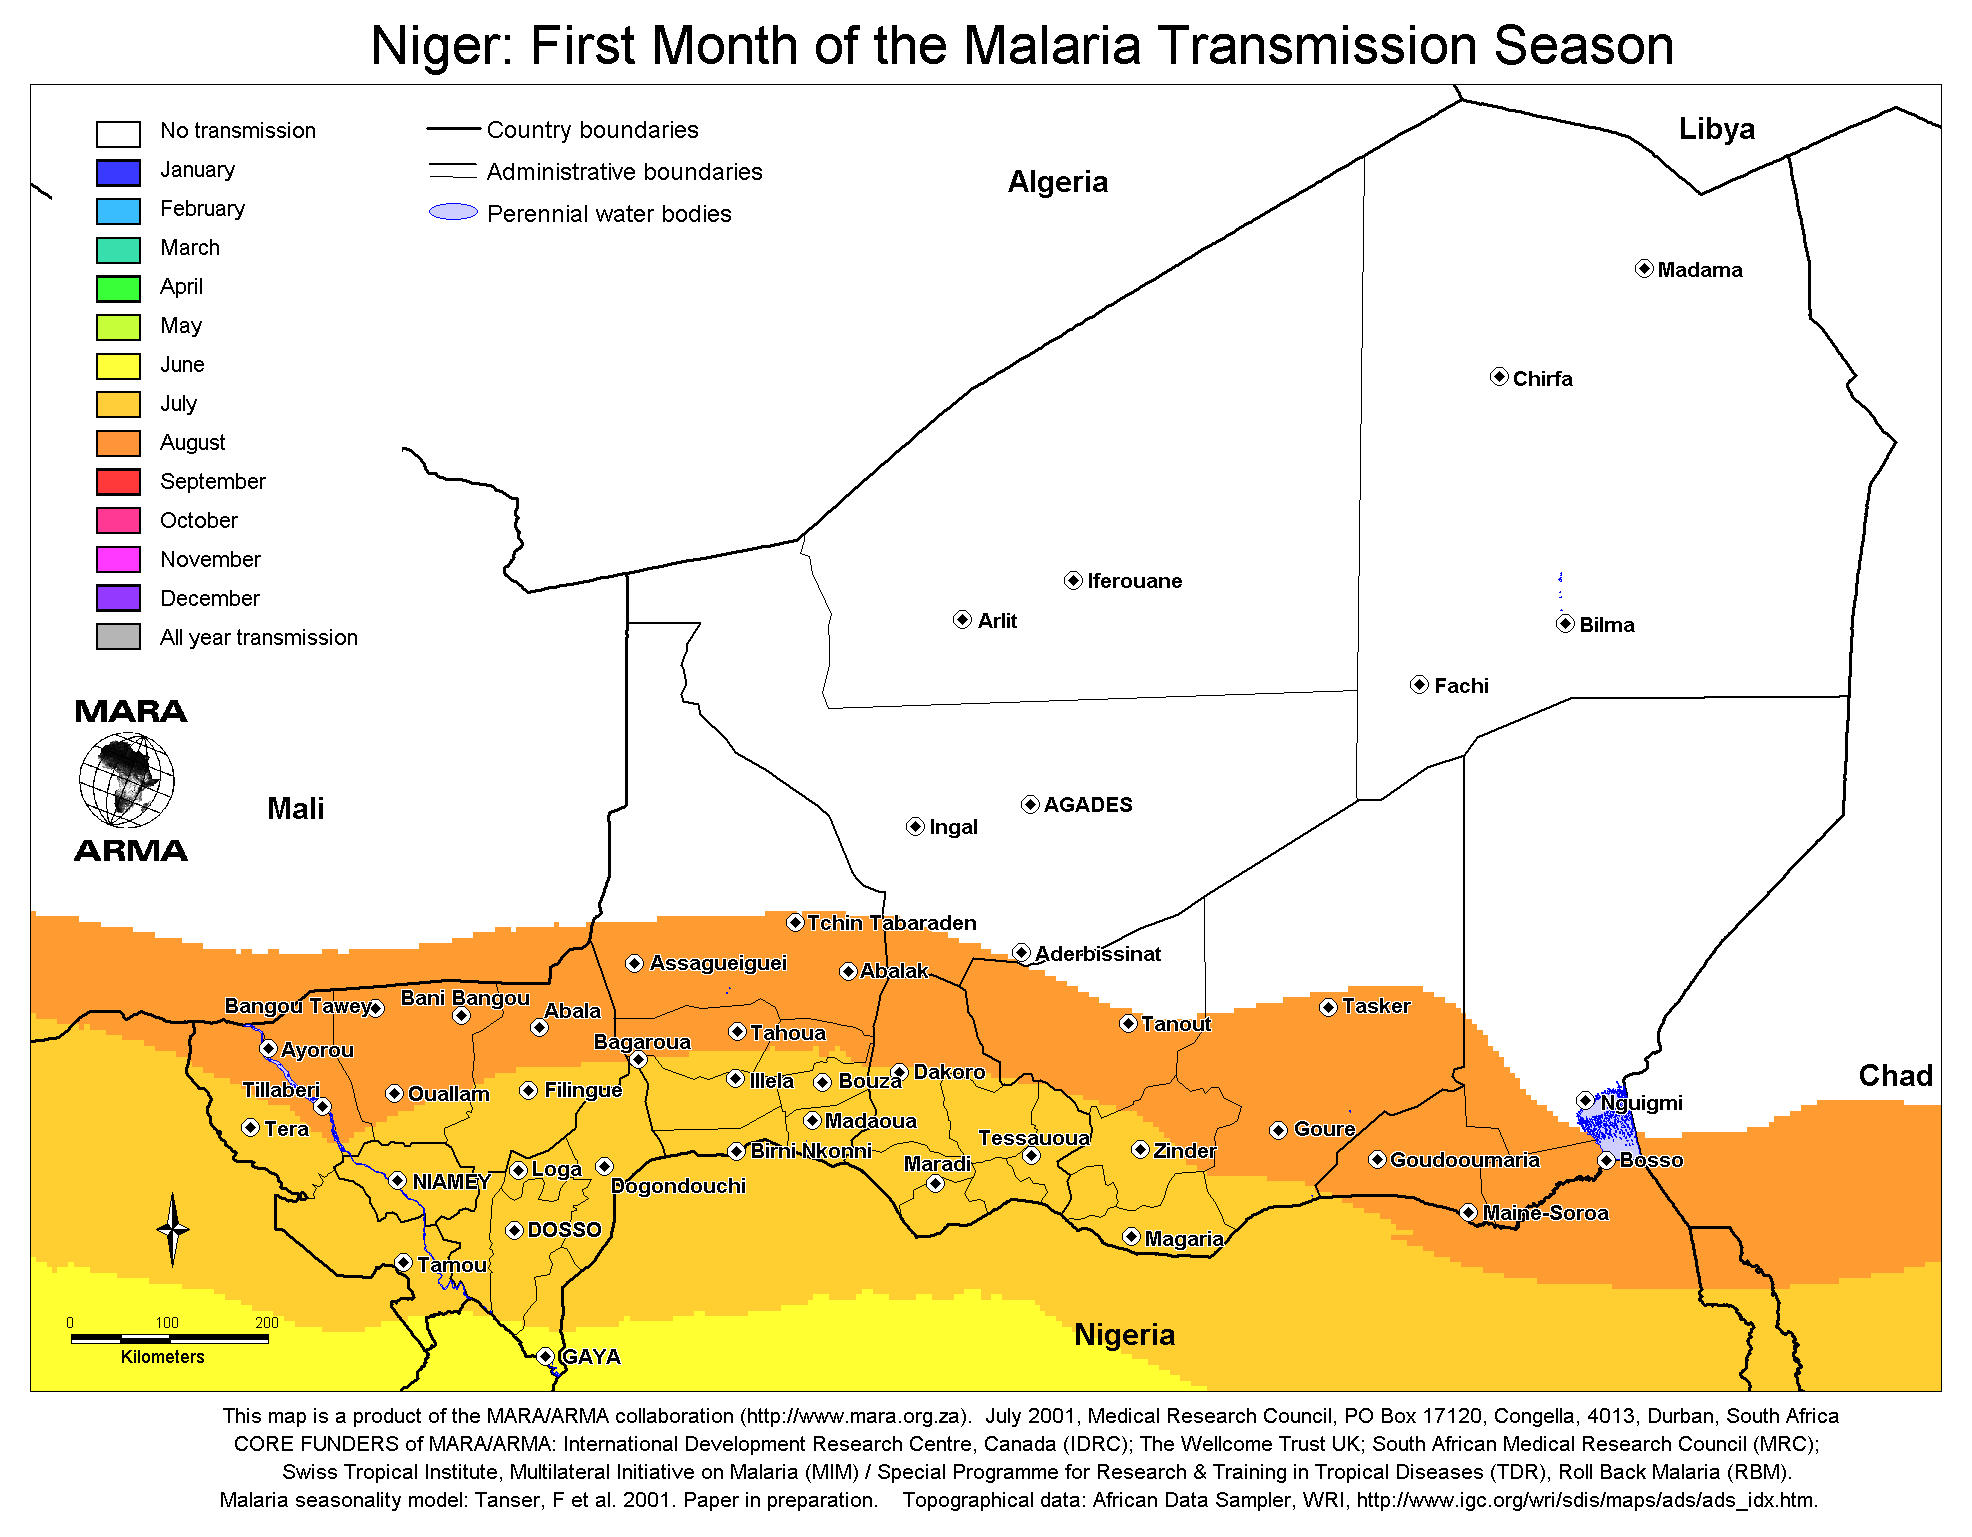
 | www.mara.org.za (NgrFirstMonth) | first month of the malaria season | Niger | - | - | - | - | MSM results |
|---|
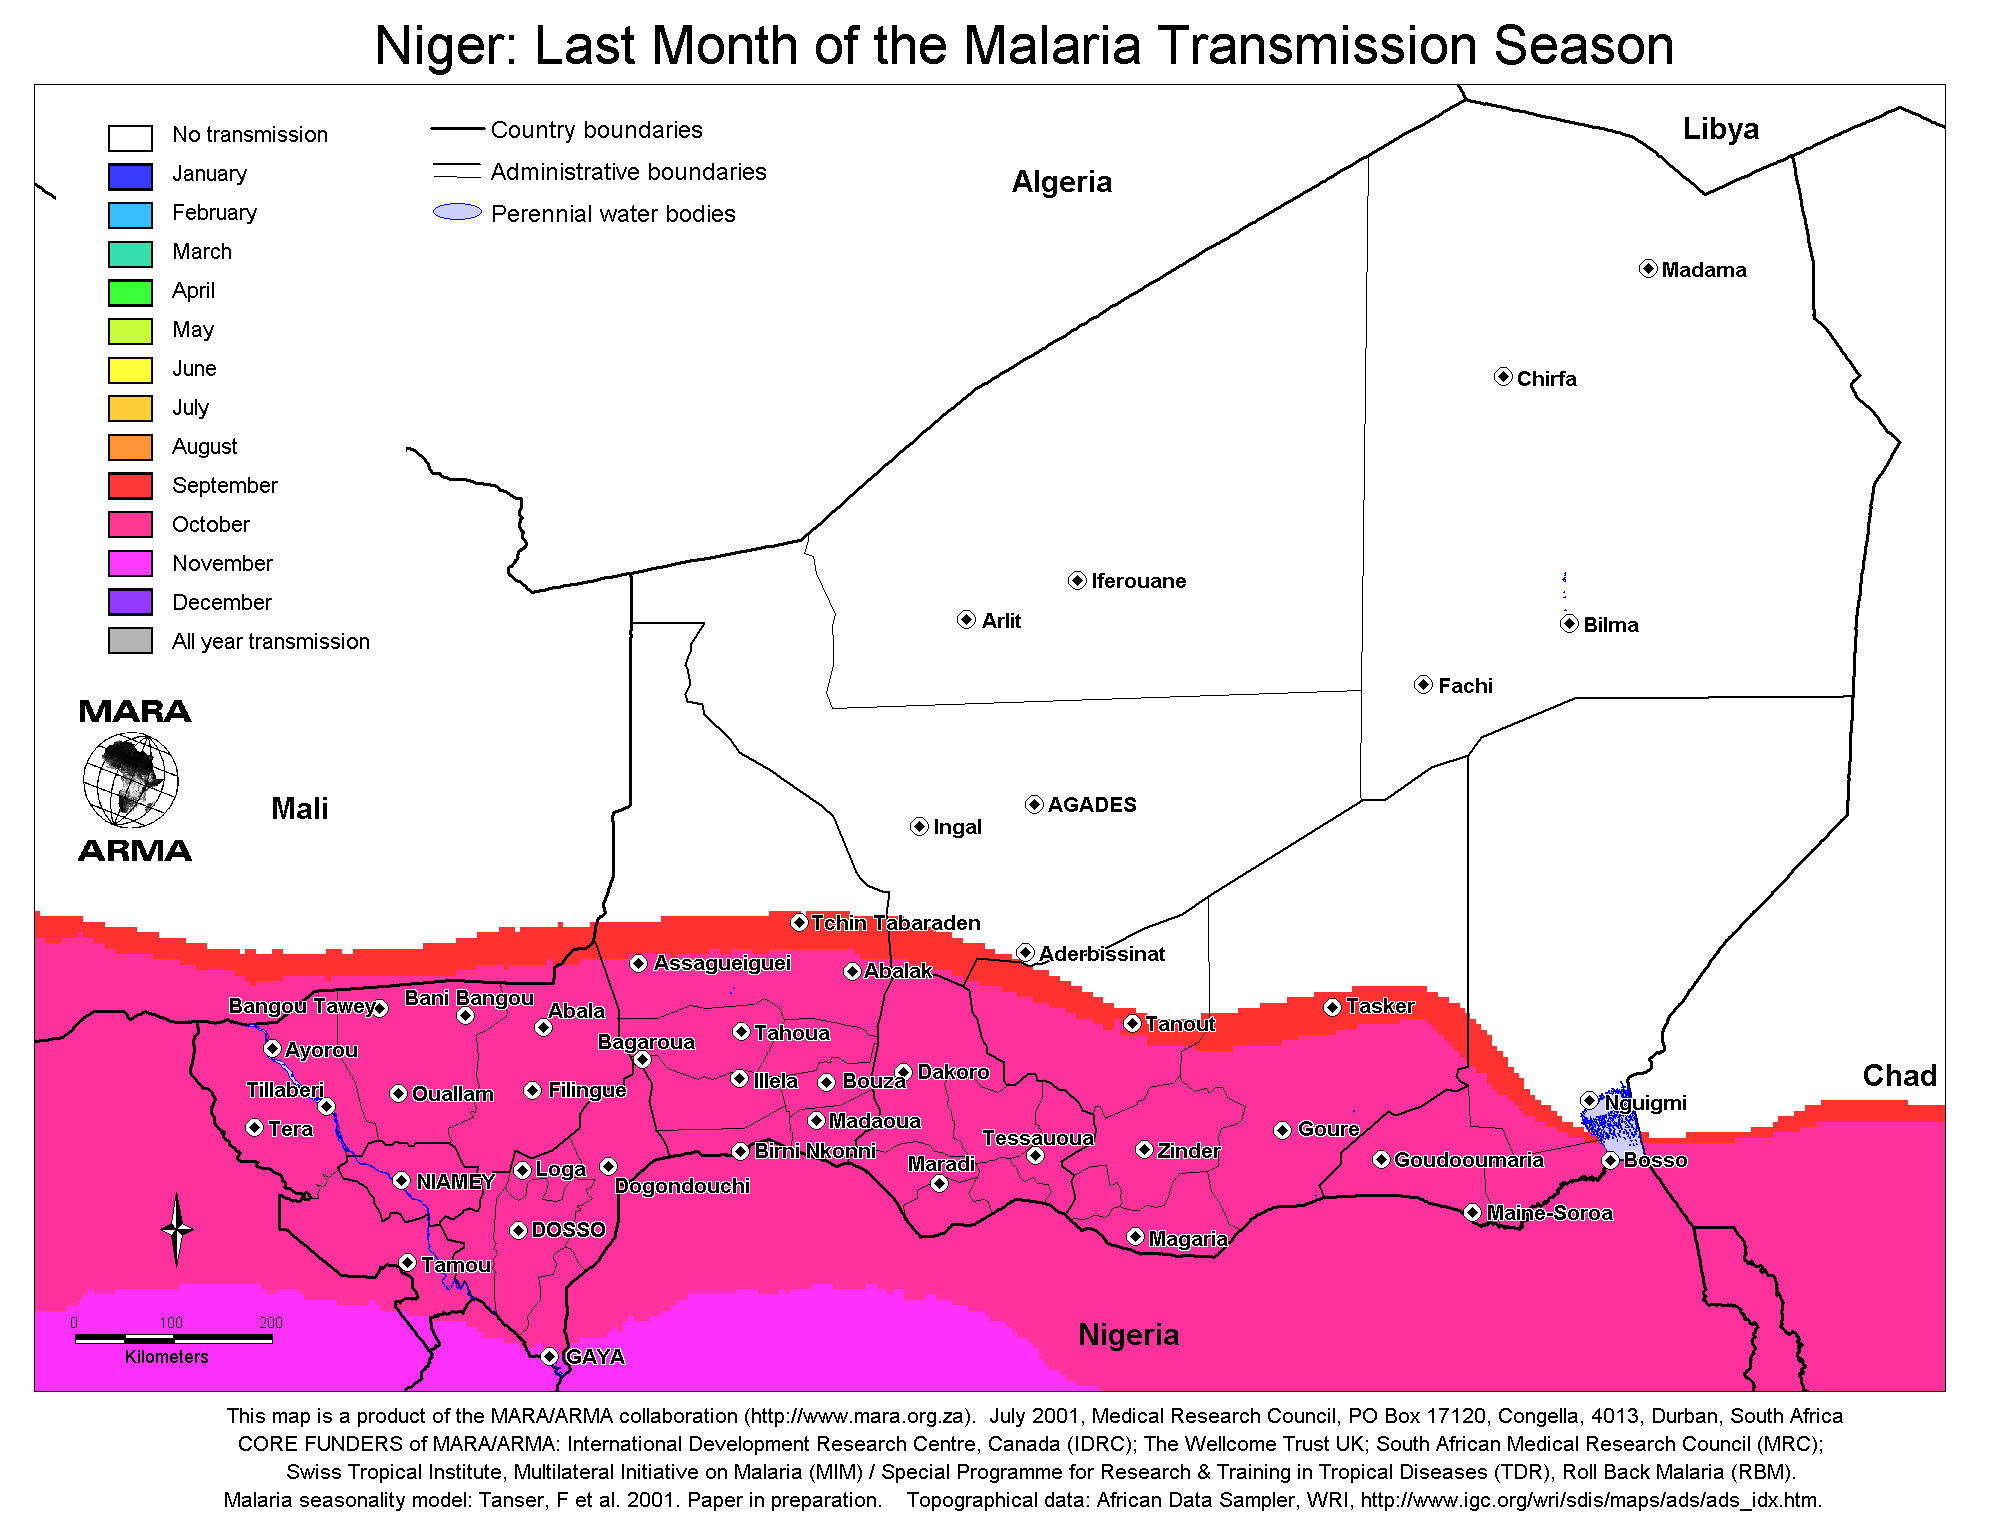
 | www.mara.org.za (NgrLastMonth) | last month of the malaria season | Niger | - | - | - | - | MSM results |
|---|
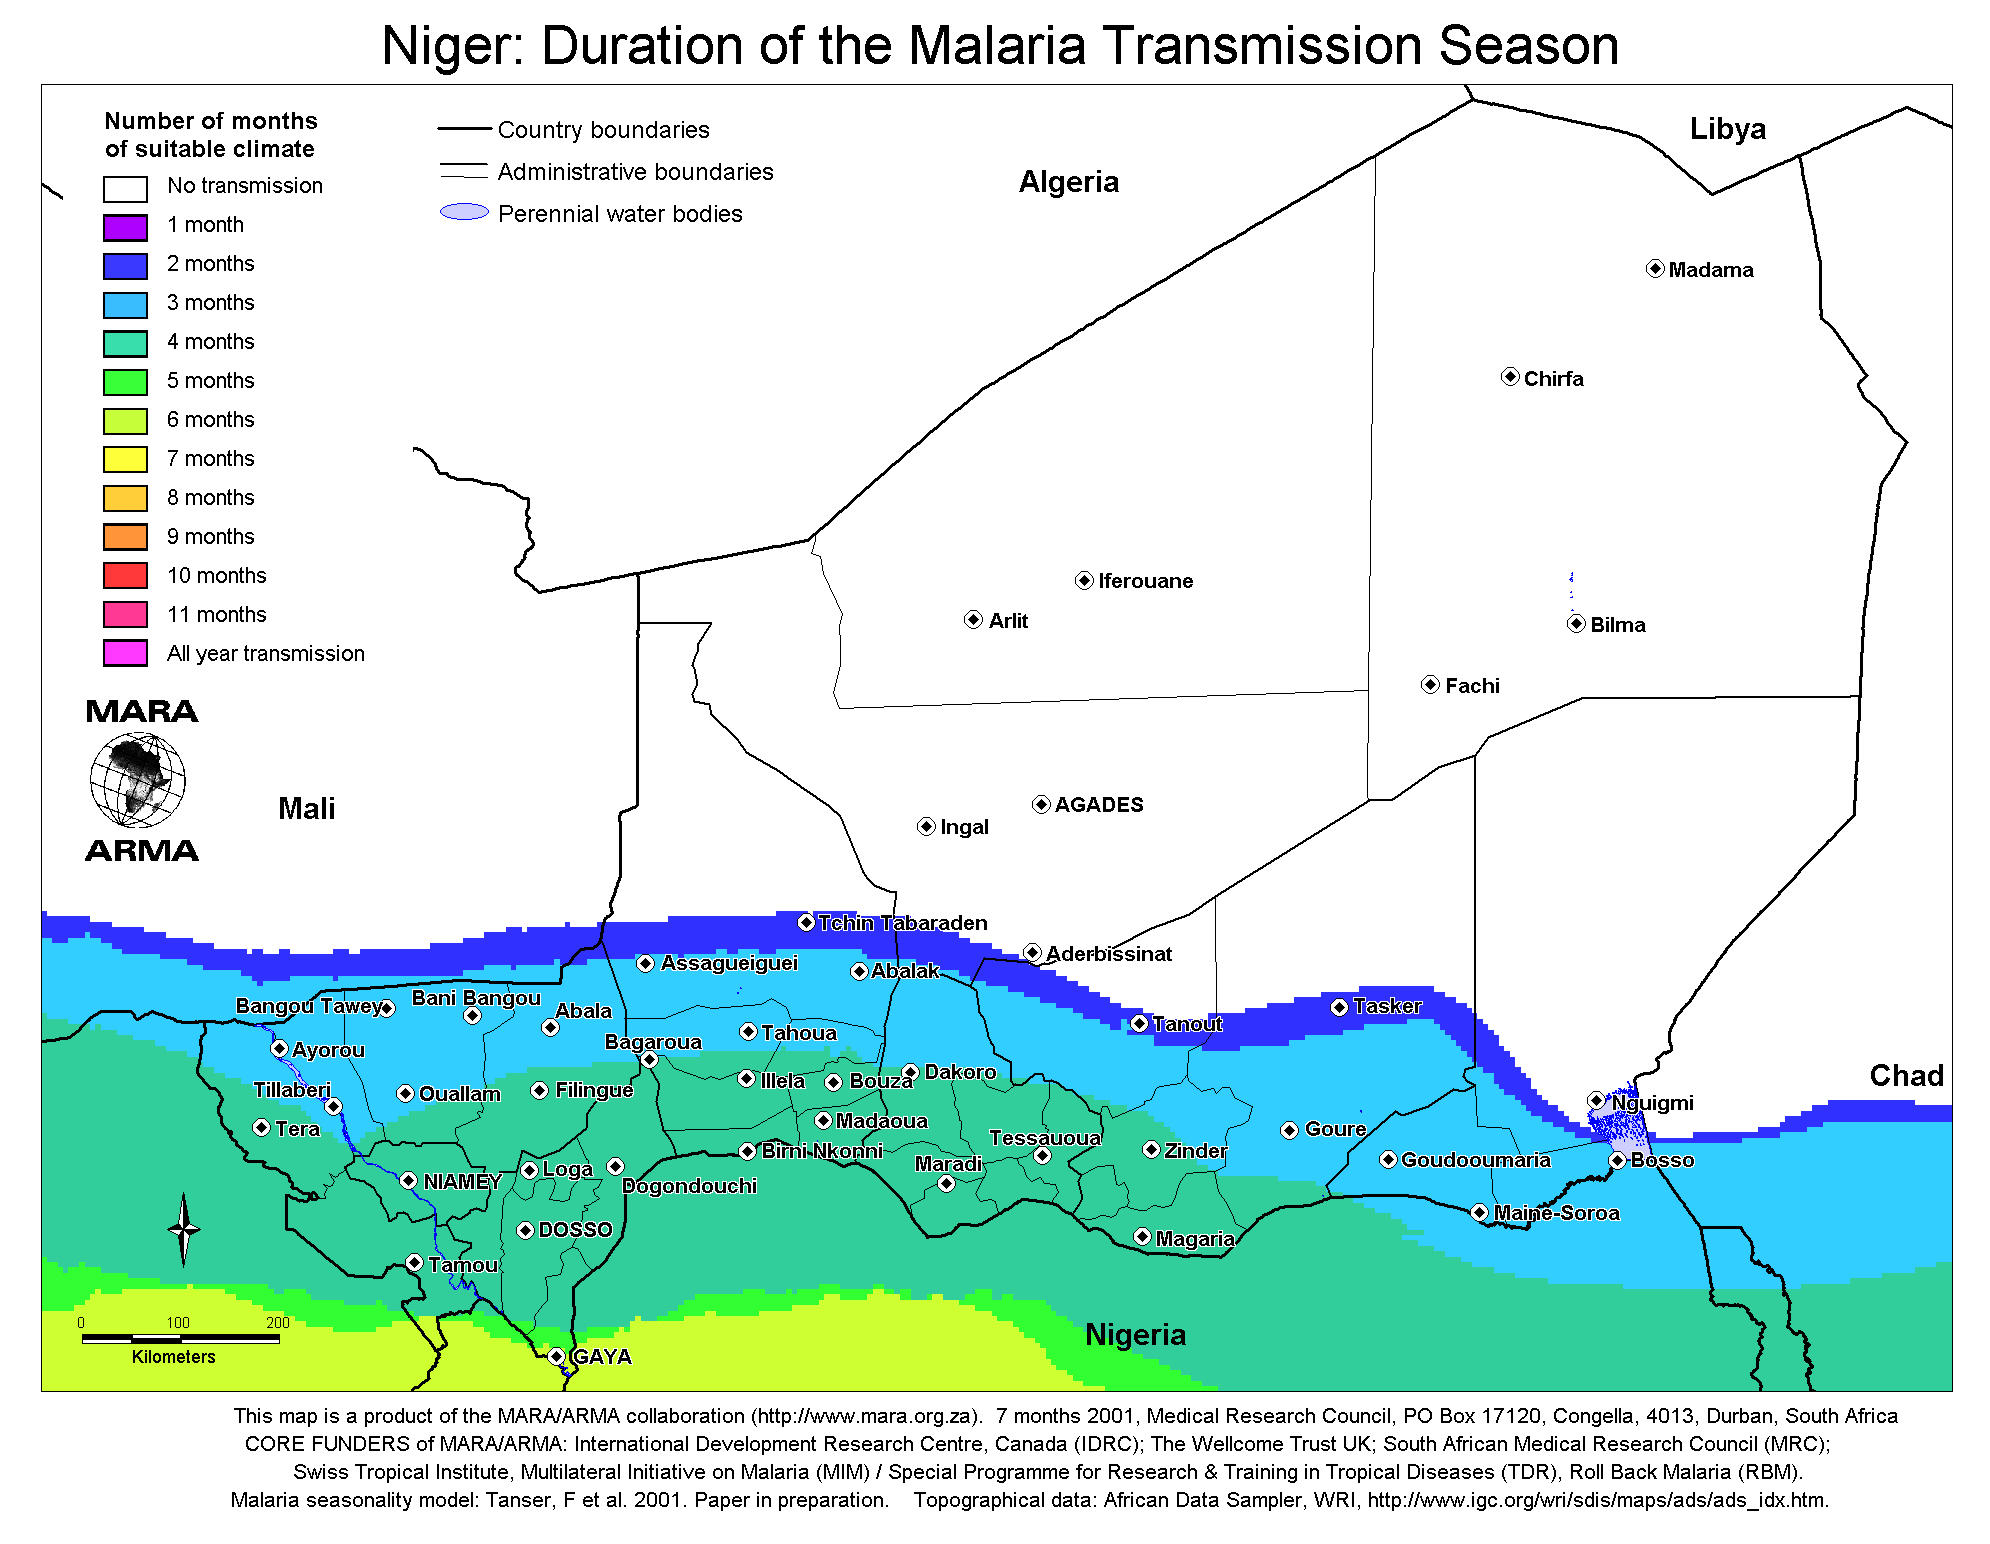
 | www.mara.org.za (NgrMonthsRisk) | duration of the malaria season | Niger | - | - | - | - | MSM results |
|---|
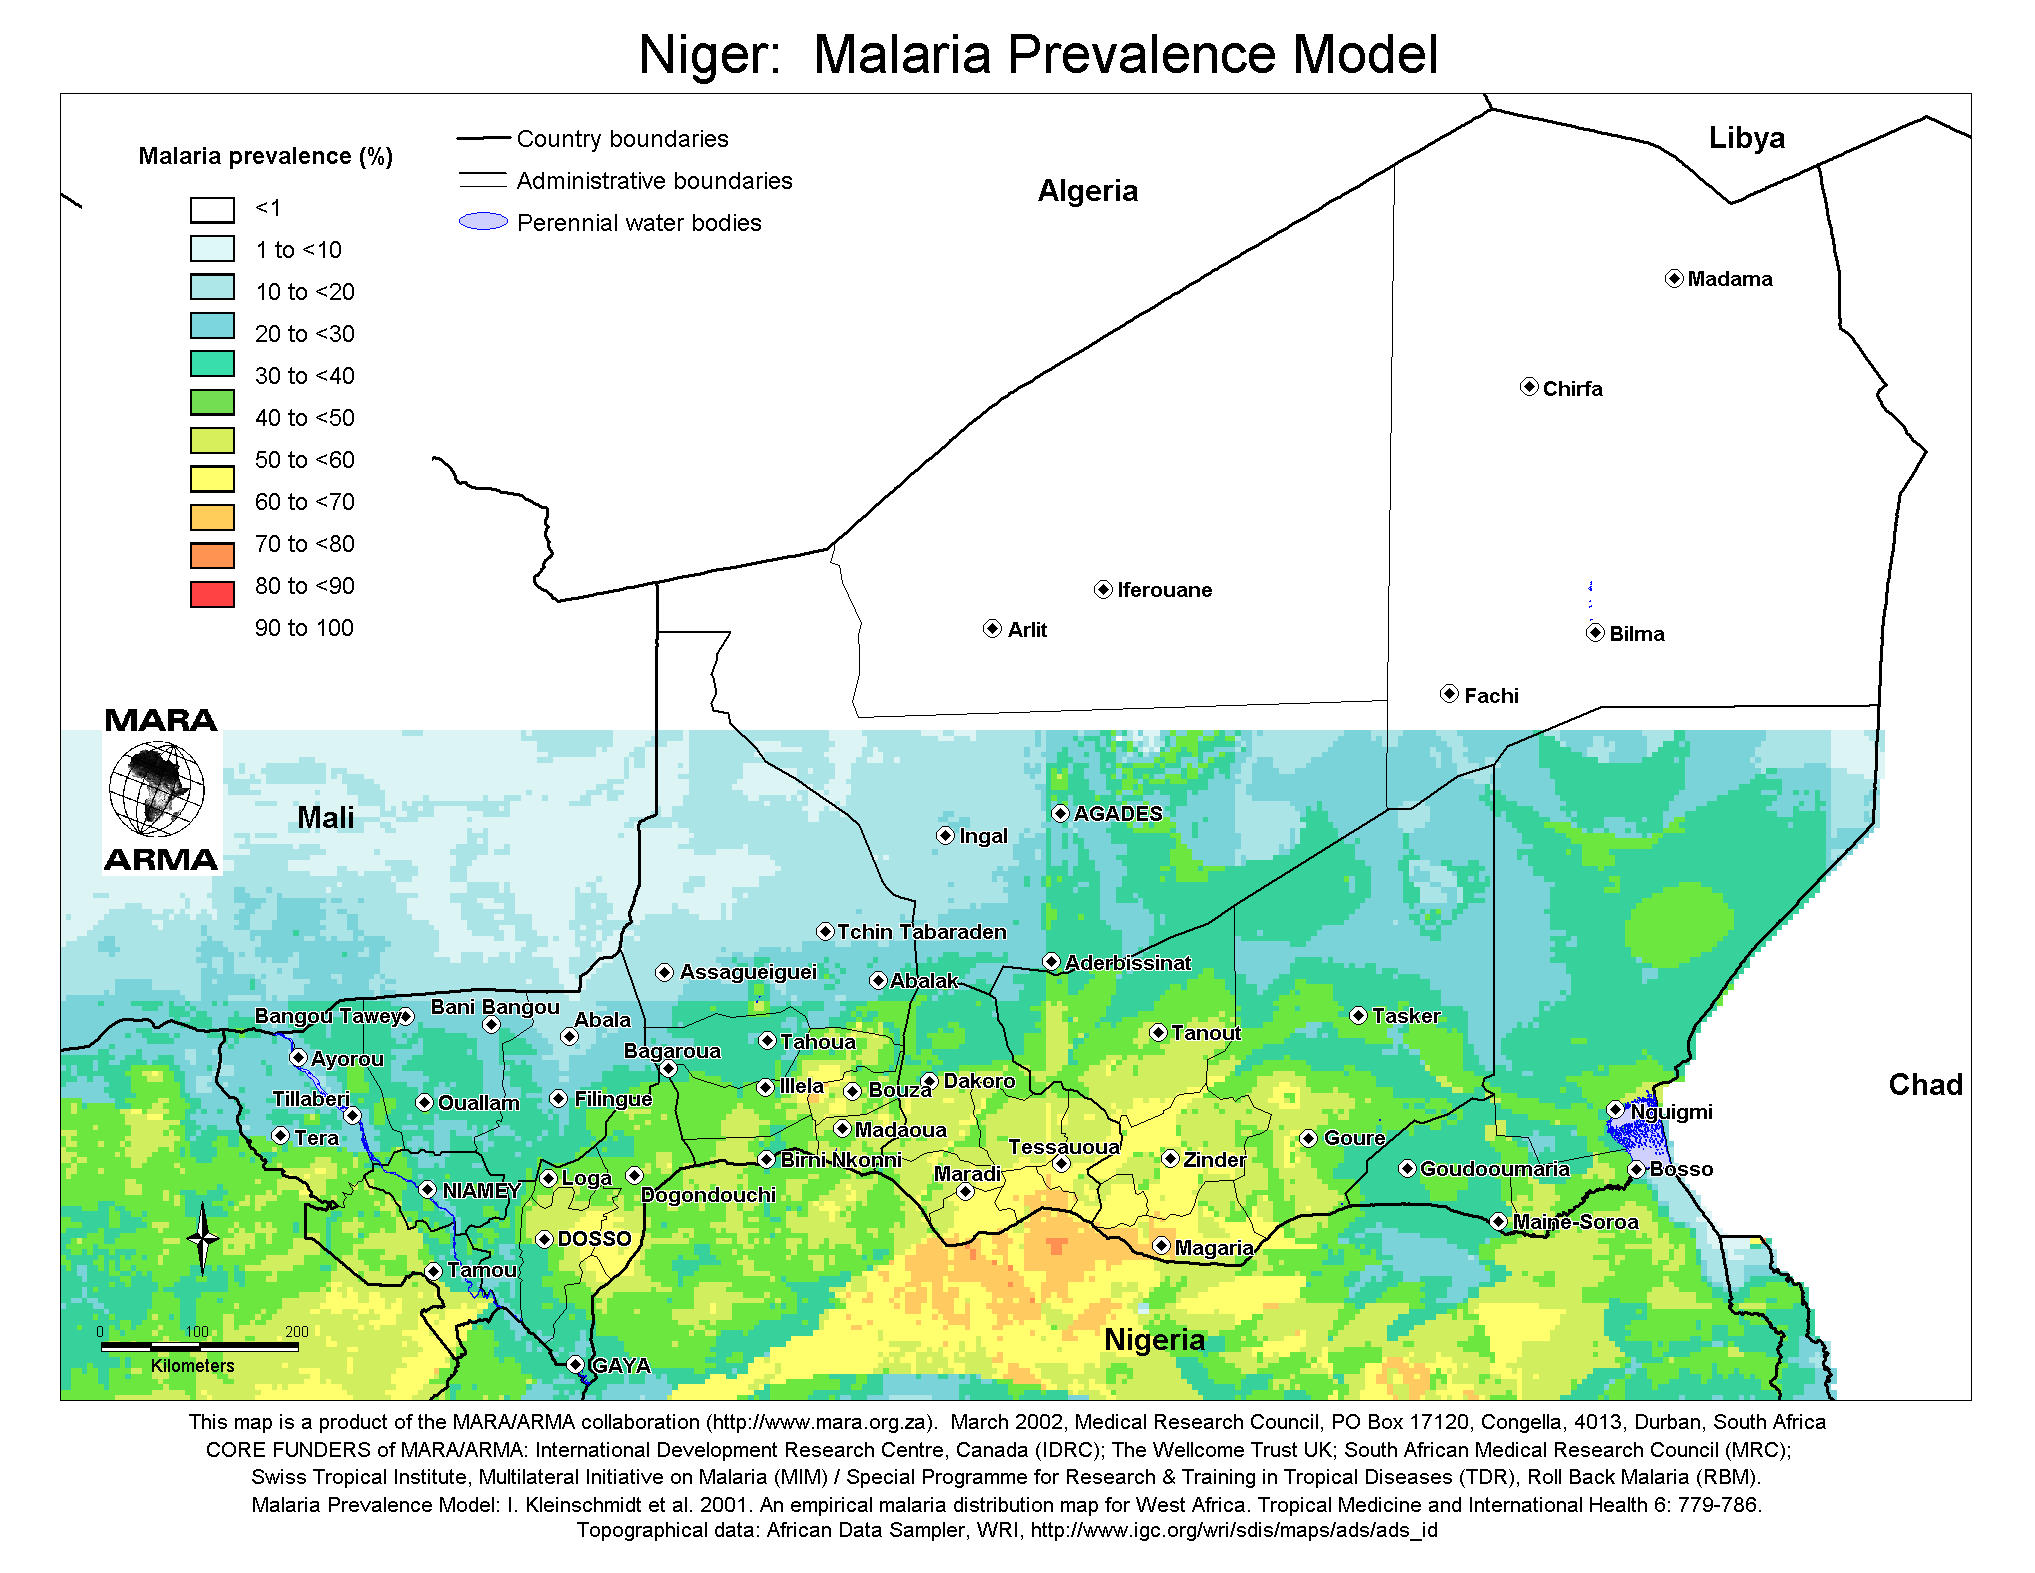
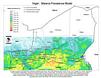 | www.mara.org.za (NgrPrevModel) | calculated PR | Niger | - | - | - | - | MARA prevalence model |
|---|
| www.mara.org.za (NgrPrevModel) | calculated PR | Niger | - | - | - | - | MARA prevalence model |
|---|
 | www.mara.org.za (NgrSeasonality) | malaria seasonality | Niger | - | - | - | - | MSM results |
|---|
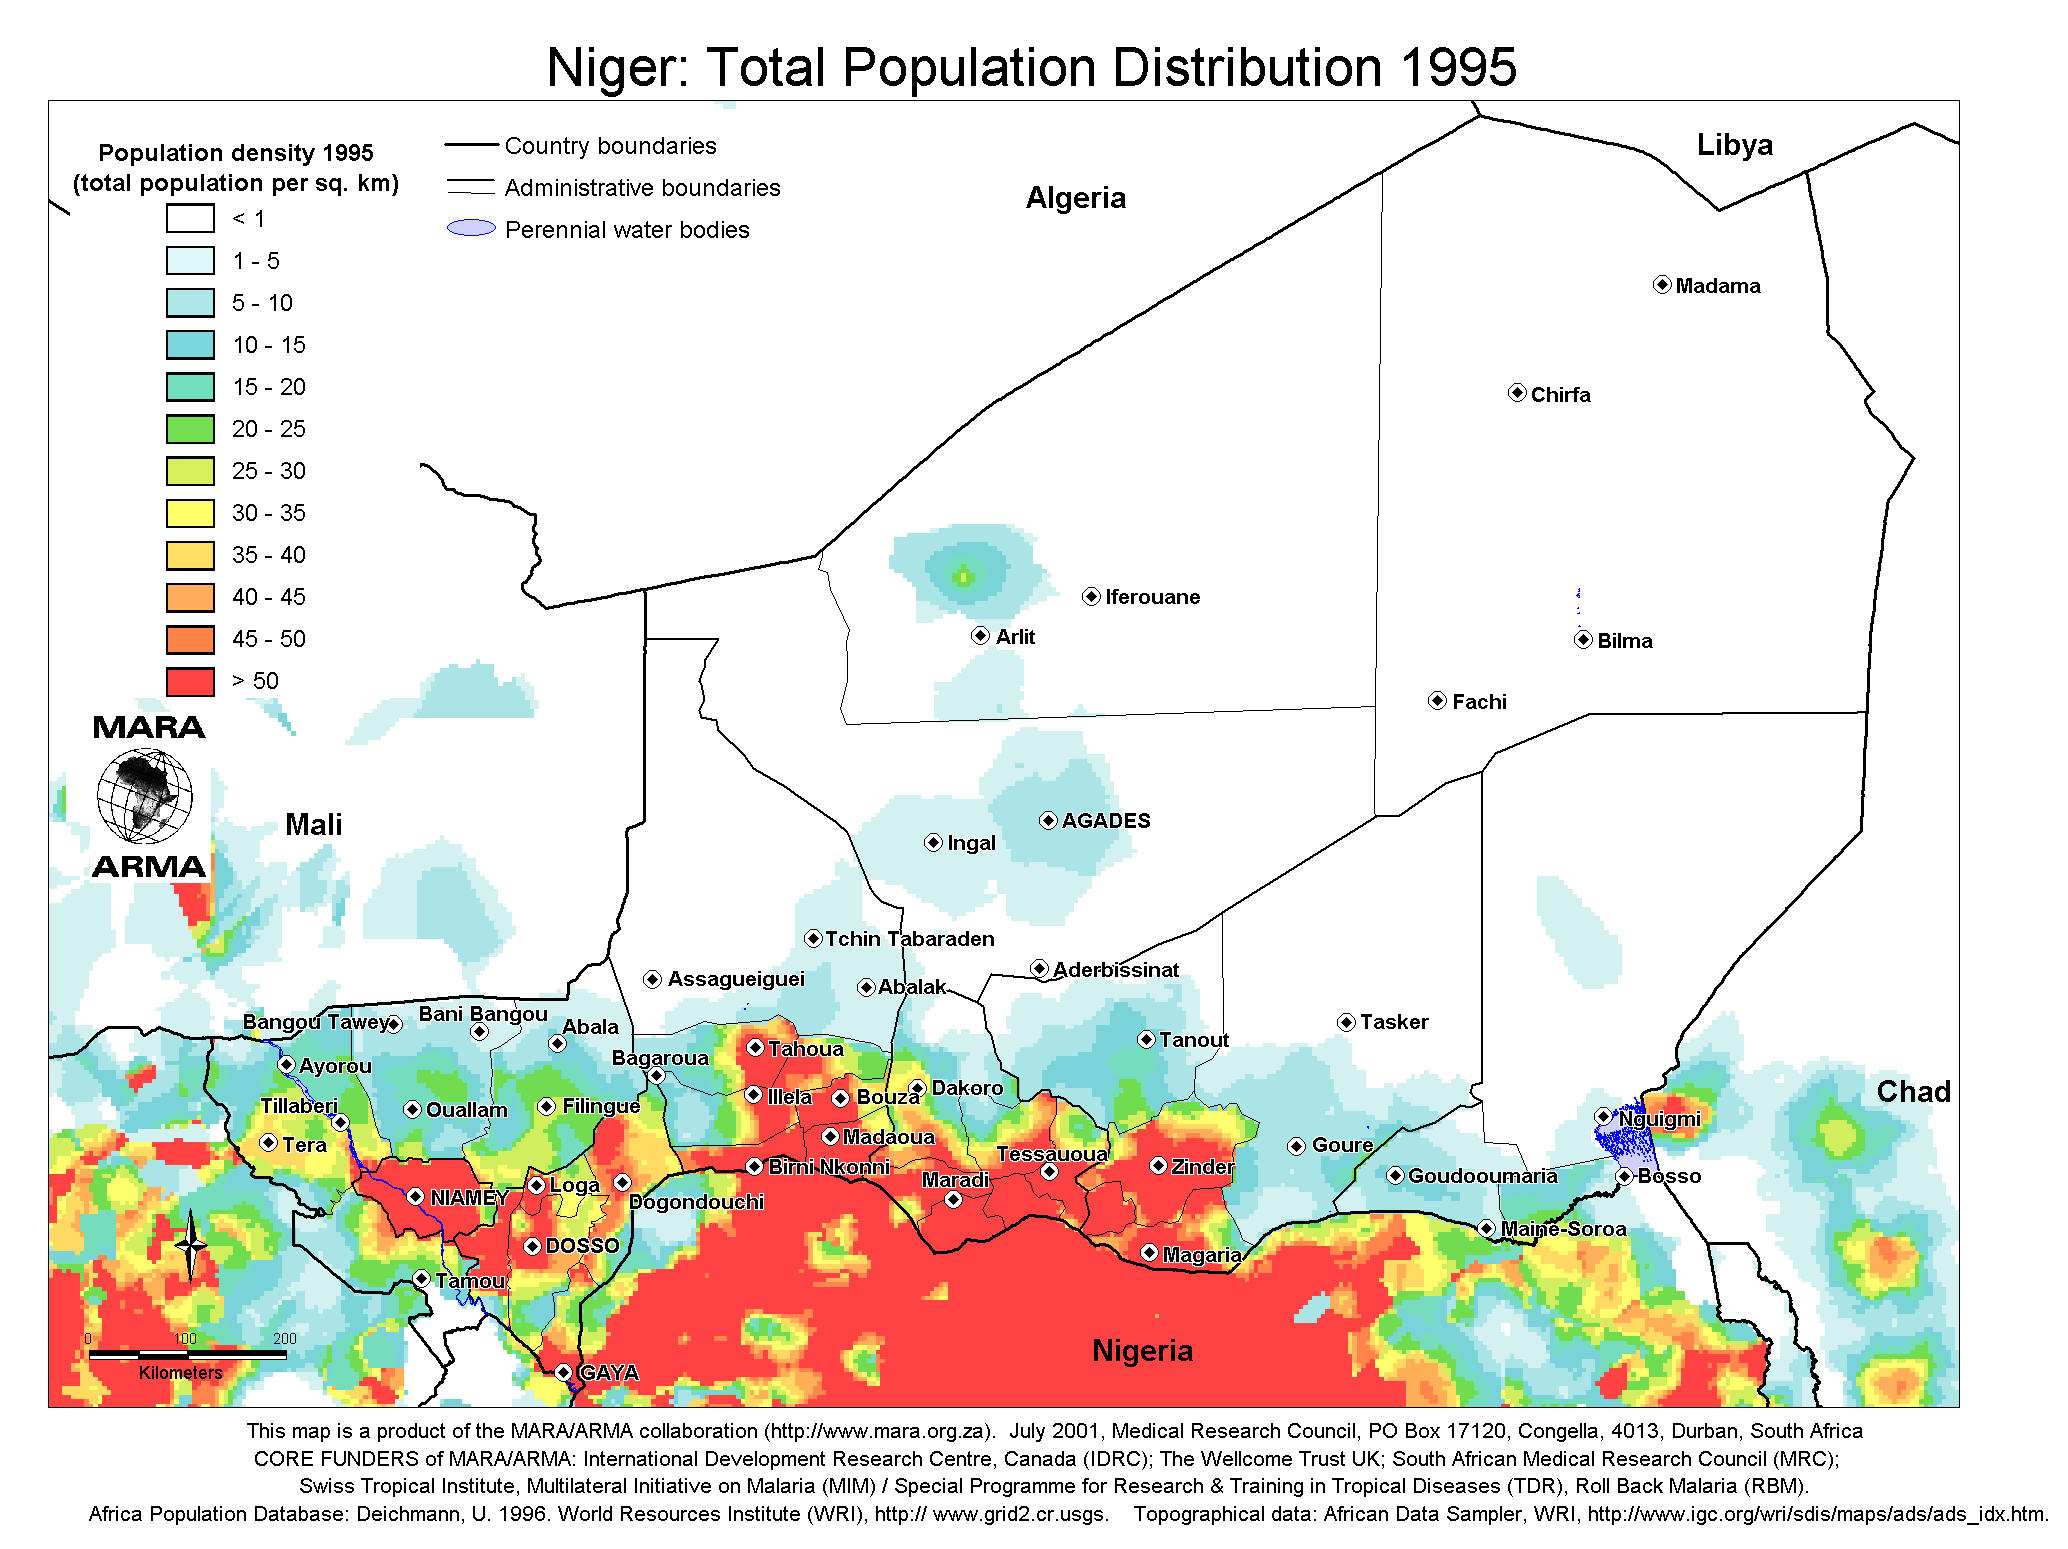
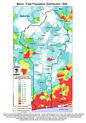
 | www.mara.org.za (NgrTotPopulation95) | population density | Niger | - | - | 1995 | - | - |
|---|