The MARA Seasonality Model (MSM)
MARA Distribution Model (MDM)
Based on climate variables alone the Mapping Malaria Risk in Africa project (MARA) has developed
a distribution model of malaria in
sub-Saharan Africa. The so called MARA Distribution Model (MDM) was introduced by Craig et al. (1999)
and for example analysed different transmission intensities in Kenya (Snow et al. 1998b).
The model is based on monthly precipitation and temperature criteria that try to distinguish
between suitable and unsuitable atmospheric climate conditions for the transmission of malaria.
According to this climate malaria model the distribution of malaria is probable when precipitation is at
least 80 mm per month and when daily average temperatures exceed 20°C.
MARA Seasonality Model (MSM)
One shortcoming of the MARA
Distribution Model is that malaria seasons are not defined. For this reason, Tanser et al. (2003)
developed the so called MARA Seasonality Model (MSM) that is accounting for the seasonality of
malaria. In contrast to the MARA Distribution Model, which is a fuzzy logic model, the MSM is using
a Boolean logic approach. Tanser et al. (2003) defined different temperature and precipitation criteria. At a given
location these criteria decide whether a month is suitable for malaria or not (cp. Tab.). The model is using two
monthly and three yearly climate variables. On a monthly basis the 3-month moving average temperature
(T3m) and 3-month moving averaged monthly precipitation
(e.g. for July, the calculation includes preceding and the actual month, i.e. May, June and July)
is applied since atmospheric conditions of an isolated month are not adequate for the distribution
of malaria. In addition the yearly minimum temperature, the standard
deviation of the average monthly temperature, and the existence of a catalyst month are utilised.
The yearly minimum temperature has to exceed 5°C since mosquito populations are reduced at
very low temperatures. Tanser et al. (2003) analysed climatic profiles of stable and seasonal
malarious areas. They assume that the 3-month moving average temperature has to exceed the total of
19.5°C and the standard deviation of the average monthly temperature.
Vector breeding sites are depending on preceding precipitation events. Hence, also for
the precipitation criteria a 3-month moving average is used. Moreover, the MSM calls for a
catalyst month of 80 mm in order to provide adequate vector breeding sites.
The spatiotemporal validation of the MSM was performed between 1929 and 1994 by 3791 laboratory-confirmed
parasite-ratio surveys of one month duration (3199 positive and 592 negative surveys).
It was analysed whether MSM was able to predict the malaria occurrence or non-occurrence
to within a month. MSM accurately predicted areas of malaria transmission in 63% of the
surveys (spatial sensitivity). The malaria occurrence in any month was correcty
predicted by the model in 90% of the cases (temporal sensitivity). Tanser et al. (2003)
state that a specificity within 1-month temporal accuracy of 96% was obtained. Unfortunately,
it is not clear from the study what spatial/temporal sensitivity, and specifity excactly mean.
|
| criteria | variable | threshold |
| 1 | T3m | ≥ 19.5°C + &sigma(Tm) |
| 2 | RR3m | ≥ 60 mm |
| 3 | RRm | at least 1 month: ≥ 80 mm |
| 4 | Tmin,m | ≥ 5°C |
| 5 | criteria 1-4 | 1 month interruption in transmission is assigned transmission status |
|
Tab.: Criteria used by the MSM to calculate months suitable for malaria transmission in Africa.
|
| a) |
|
b) |
|
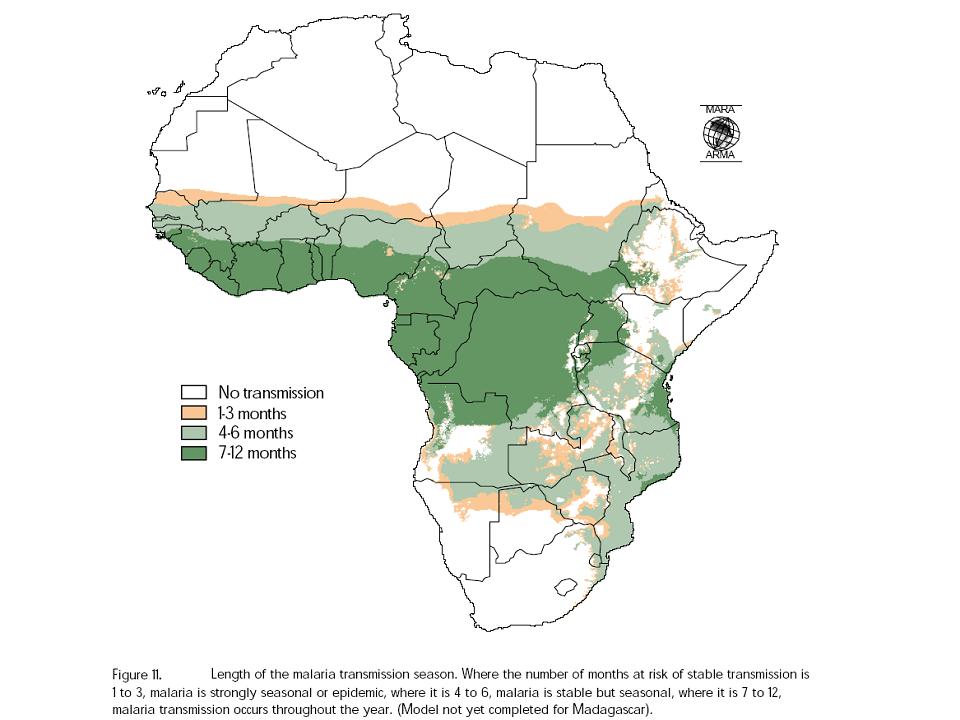
Fig. 1:
(a) Length of the malaria season as predicted by MSM (Fig. 11 in MARA/ARMA 1998).
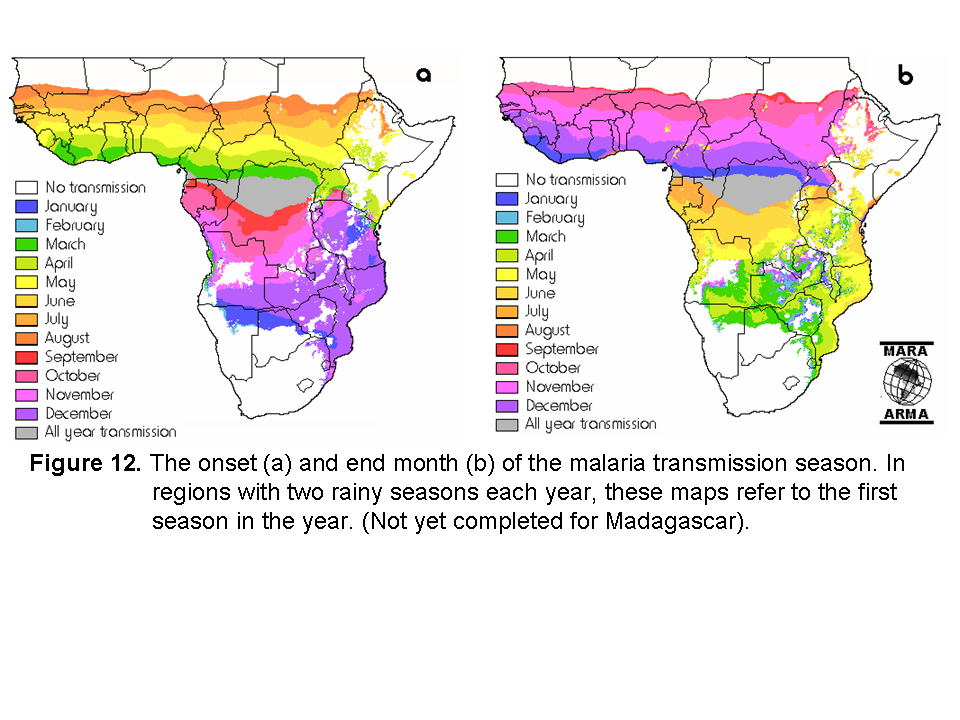
(b) Onset (left) and end month (right) of the malaria transmission as simulated by MSM.
In areas with two annual rainy seasons, the maps refer to the first rainy season (Fig. 12
in MARA/ARMA 1998). Results in (a) and (b) correspond to the climate conditions between 1920 and 1980
(Hutchinson et al. 1996).
|