|
MSM present-day simulation
The present-day ensemble runs for 1960 to 2000 of the REgional MOdel (REMO)
(Paeth et al. 2007; see page "Data input") have been used
for the calculation of the present-day climate conditions. The MSM was finally driven
by means of this climate data.
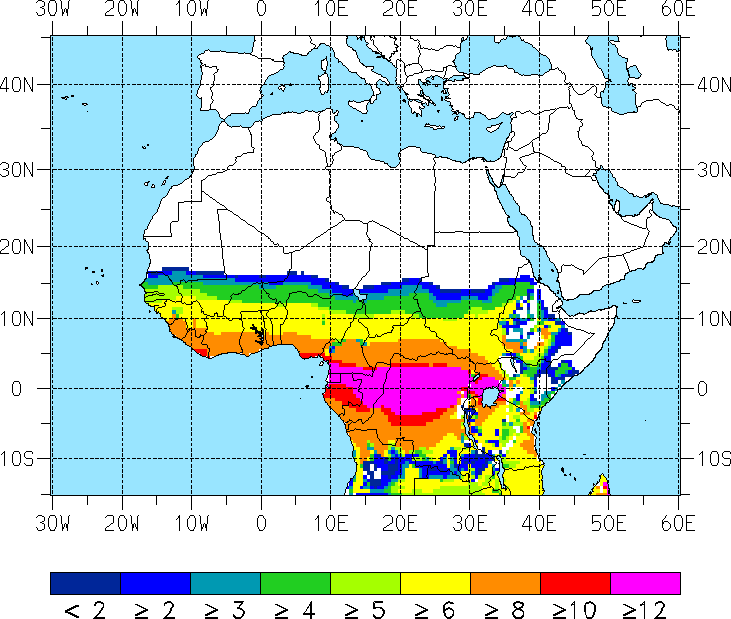
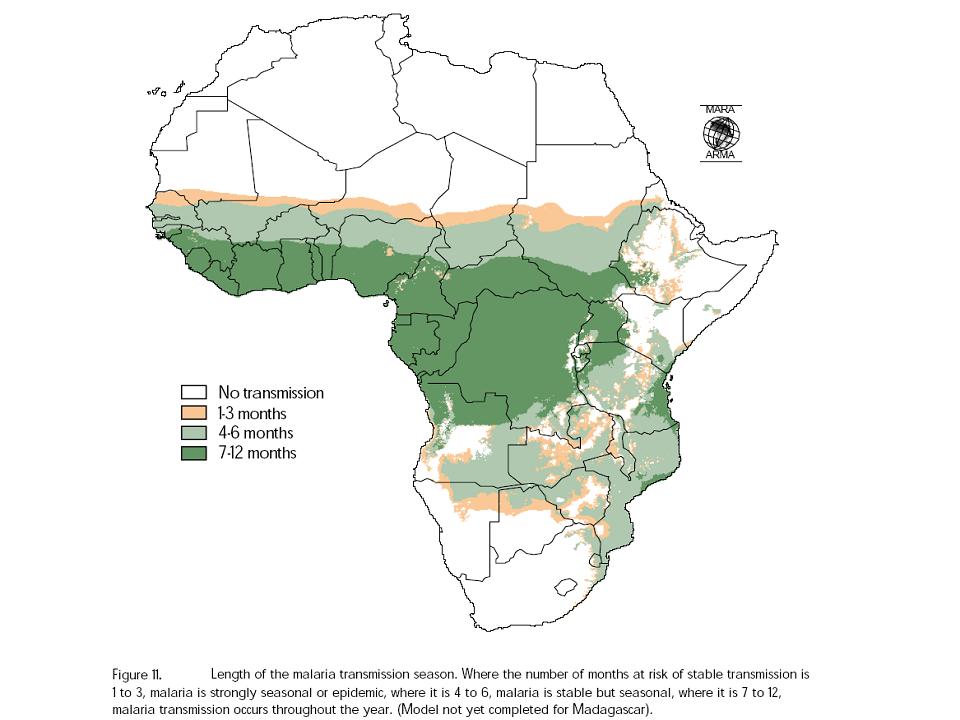
Length of the malaria season
In agreement with the annual precipitation amounts, the two-dimensional MSM simulations
show a decrease in the malaria season length from the Guinea Coast towards the Sahel
for the period 1960 to 2000 (Fig. 1a). Malaria transmission is year-round
in the equatorial tropics in the area of the largest precipitation amounts,
e.g. in southern Cameroon, Gabon, Congo, and Uganda.
The presence of highlands in East Africa is causing a more complex pattern of the distribution
of the malaria season length. Parts of Ethiopia, Kenya, Tanzania, Rwanda and Burundi are
covered by highlands and are therefore characterised by lower temperatures than nearby plain areas.
Note that temperatures in the order or even lower than the sporogonic temperature threshold
prohibit the transmission of the malaria disease. Those are the reason for short malaria seasons or even
the lack of malaria seasonality in the East African highlands. By contrast the lack of
a malaria season around the Horn of Africa is due to low annual precipitation amounts.
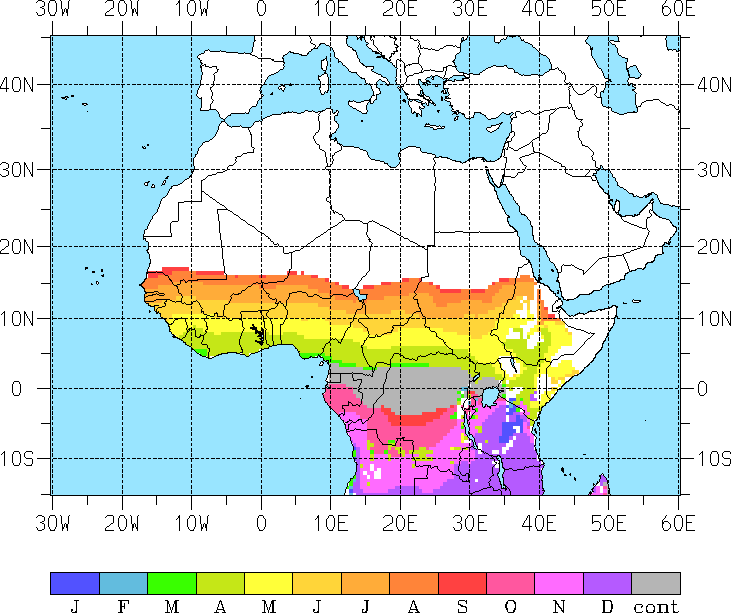
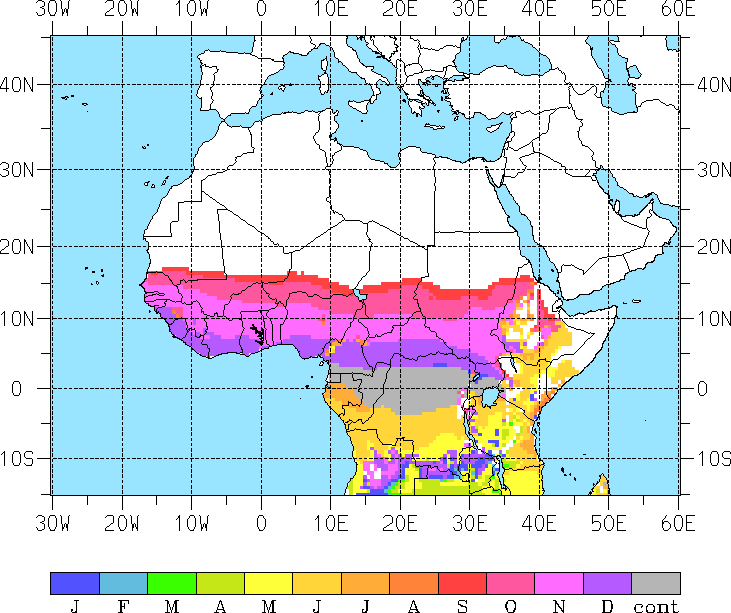
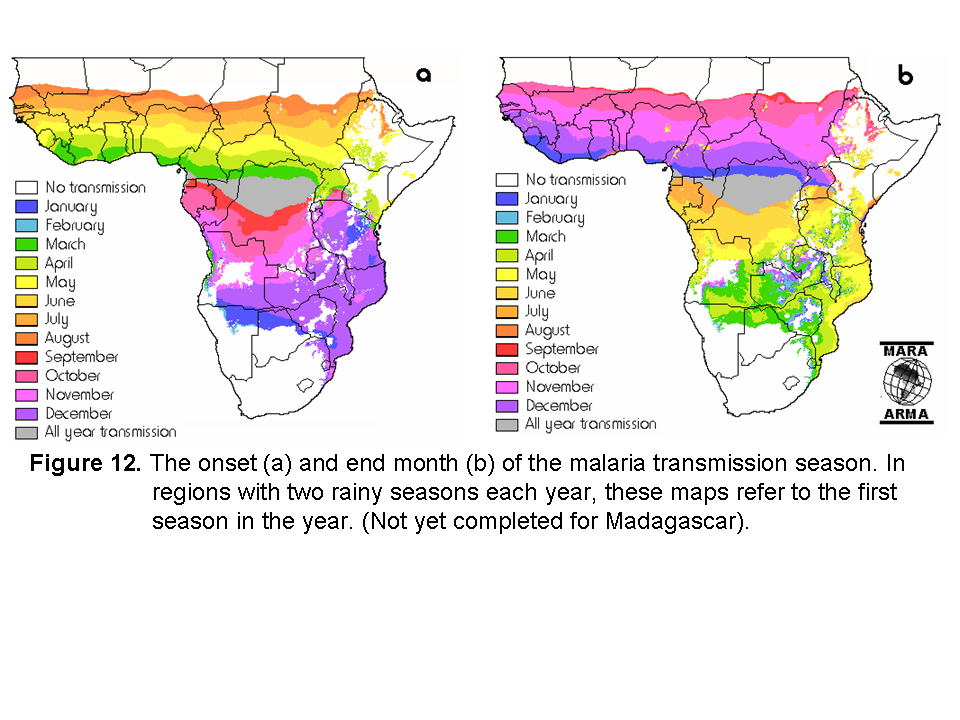
Onset and end of malaria transmission
In West Africa malaria transmission starts shortly after the onset of the rainy season.
At the Guinean coast the malaria season therefore starts
in March and April and finally ends in November during the retreat of the West African monsoon.
Because of the late start of the monsoon in the Sahel, the start of the
malaria transmission is delayed to about July/August and quickly ends between September/October.
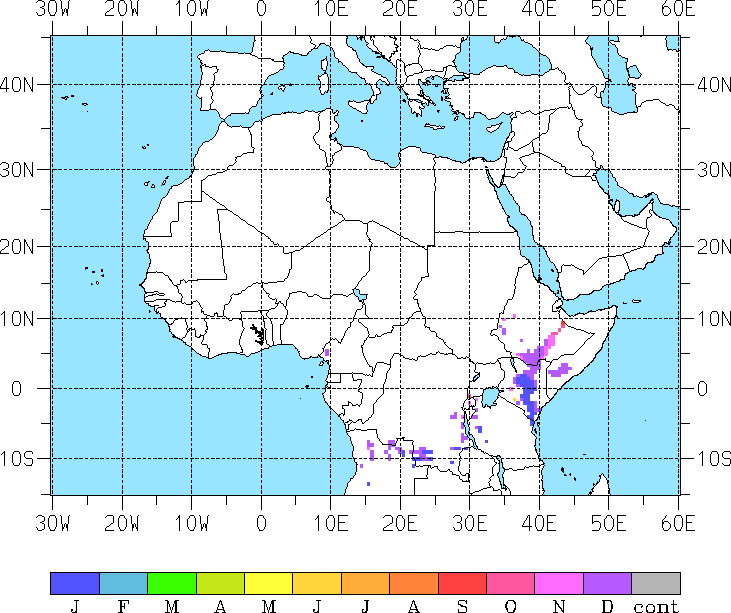
Due to partly two annual rainy seasons in East Africa the MSM simulates partly two malaria seasons.
The first (second) season starts in boreal spring (autumn) and ends in
boreal summer (winter).
Most regions south of the equatorial tropics are characterised by malaria transmission
between boreal autumn and early boreal summer. However, due to the presence of high topography in
parts of Angola and Zambia a complex pattern of malaria seasonality is simulated by the MSM.
In such areas transmission of malaria is partly restricted between November and January.
Whereas other parts show two distinct malaria seasons, one between November and January as well as another short
season between April and Mai.
Comparison with MARA maps
The malaria seasonality corresponding to MSM simulations based on data from REMO are comparable
to the maps produced by the MARA project (cp. Fig. 2). However, it was found that
the onset of the West African monsoon was delayed in the REMO simulations. For this reason
malaria season starts partly one month later than indicated by the MARA maps. Moreover
at the Guinean coast transmission ends later in the MARA map than in the performed MSM simulations.
This fact is again related to the REMO precipitation data.
|
| Seas |
| SSeas |
| ESeas |
| a) |
|
b) |
|
c) |
|
| d) |
|
e) |
|
|
Fig. 1: MSM simulations of malaria seasonality based on
climate conditions from three REMO ensemble runs between 1960 and 2000.
(a) Length of the malaria season (Seas in months). (b) Start (SSeas) and (c) end month
(ESeas) of the malaria transmission (cont: year-round transmission).
(d) And (e) same as (b) and (c) but for the second malaria season. Note, in
(d) and (e) are only areas with two annual rainy seasons and therefore two
distinct malaria seasons considered.
|