| |
The simulations of various LMM parameter settings have been compared
to ten different entomological and parasitological field observations in West Africa
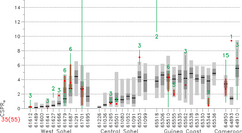
and Cameroon. These comprise the following entomological variables: the Human Biting Ratio (HBRa),
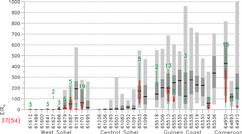
annual average CircumSporozoite Protein Rate (CSPRa),
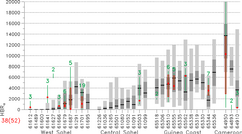
annual Entomological Inoculation Rate (EIRa),
and four variables of the malaria season (SSeas: start month; ESeas: end month;
Seas: duration of the malaria season; MSeas: number of months in which 75%
of EIRa is transmitted). Moreover, three parasitological variables are included:
the annual average (PRa), annual minimum (PRmin,a),
as well as the annual maximum (PRmax,a) of the Parasite Ratio.
The particular values of the simulations of the proposed model setting are compareable to all the
seven entomological variables (cp. the figures below). Note, during the dry season the mosquito survival
probability has been artificially lowered by 10%. This ensures that the malaria season ends more rapidly.
Some field studies indicate that the mosquito survival might be reduced by dry conditions. In Niger
for example Anopheles populations seem to drop steeply around October,
when shifts in the prevailing winds drastically reduce humidity. Favourable microclimates become gradually
scarcer as the dry season progresses (Anthony Kiszewsky, personal communication).
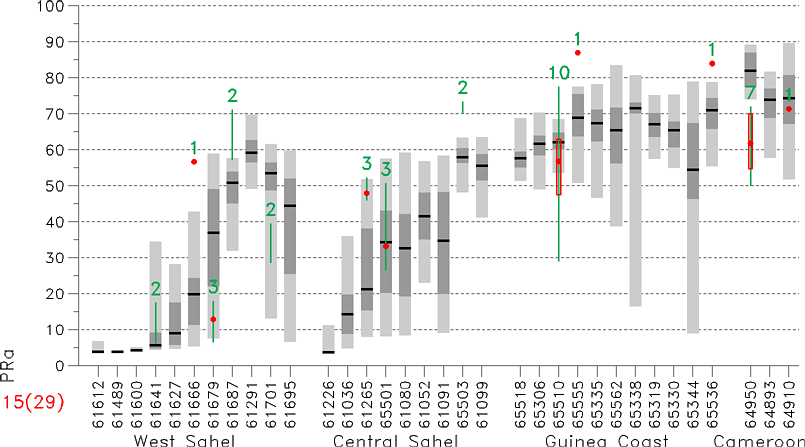
The observed values of the parasitological variales are quite heteorogeneous. In particular the measurements of
PRmin,a exhibit a remarkable spread. Nine values are higher than 50% whereas 23 values
are lower than this threshold. These differences suggest that local influences strongly affect the parasite
prevalence. However, the LMM performs better with regard to the other two parasitological variables. Note that
the PR in the LMM is mainly determined by the recovery rate. In this model setting the recovery rate has
been set to a value of 0.005. The rate of recovery from an malaria infection is a function of exposure history,
reflecting the effects of immunity (e.g. Gu et al. 2003b). Parasite clearance is therefore closely related to the
age of an individual as well as to the transmission intensity. The former fact has been found in longitudinal data
from 16 villages in the West African savanna (e.g. Molineaux and Gramiccia 1980, their Fig. 31). Daily recovery
rates were 0.0045 in infants (<1 year), fell to a minimum of 0.0016 in young children (1-4 years), and increased
again to 0.0194 in the oldest adult age group (≥43 years). The dependence on the transmission intensity
has been found at 30 sites along coastal Kenya. Gu et al. (2003b) showed that the daily parasite clearance is
lower than 0.005 at EIRa of one or less and considerably higher at intensities of
ten or more. In fact, immune individuals who control their peripheral parasitaemia clear infections faster
by a factor of up to ten (Bekessy et al. 1976). However, the LMM structure does not accounts for an immunity status
of individuals. As a result the recovery rate is independend from the transmission intensity or age of
an individual in the model, only one single setting of the recovery rate is possible. For this reason the applied
clearance rate might represents an age or area average. In fact, the value of 0.005 has been previously assessed
by Macdonald and Göckel (1964) and was also applied in classical malaria models (e.g. MacDonald et al. 1968;
Gu et al. 2003b).
Figures
| HBRa | CSPRa | EIRa | RRa |
 |
 |
 |
 |
| Seas | MSeas | SSeas | ESeas |
 |
 |
 |
 |
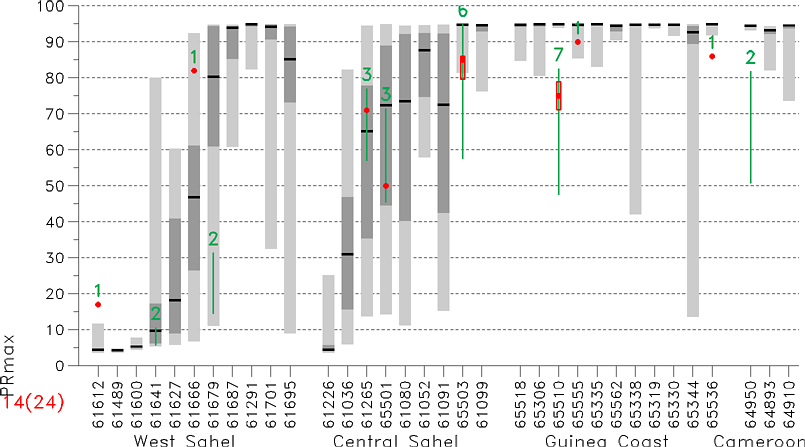
PRa | PRmin,a | PRmax,a | |
 |
 |
 |
|
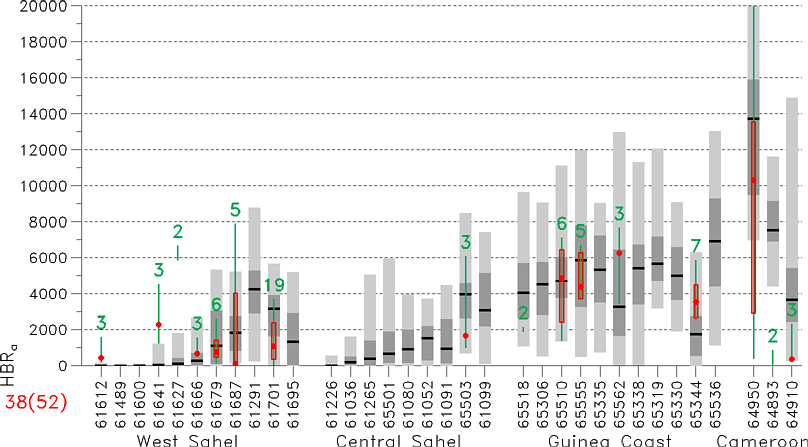
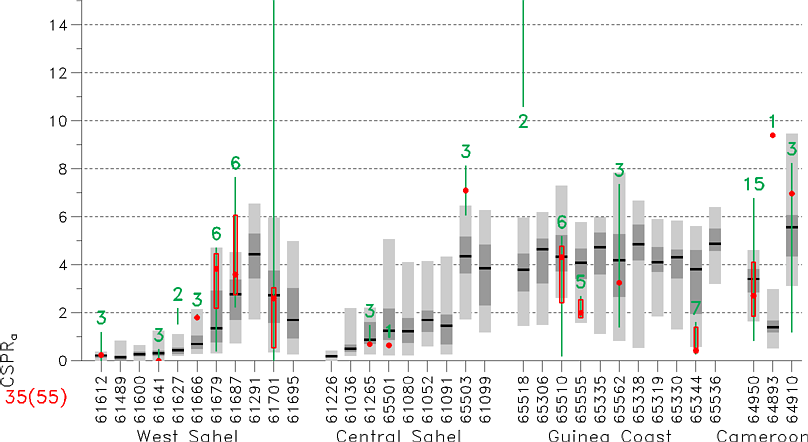
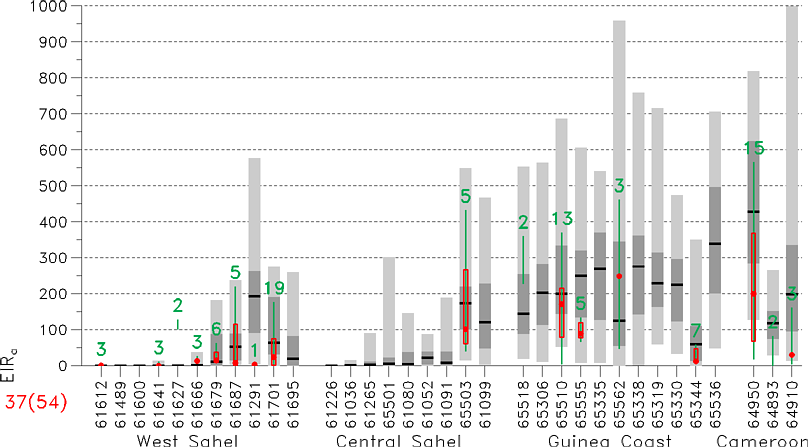
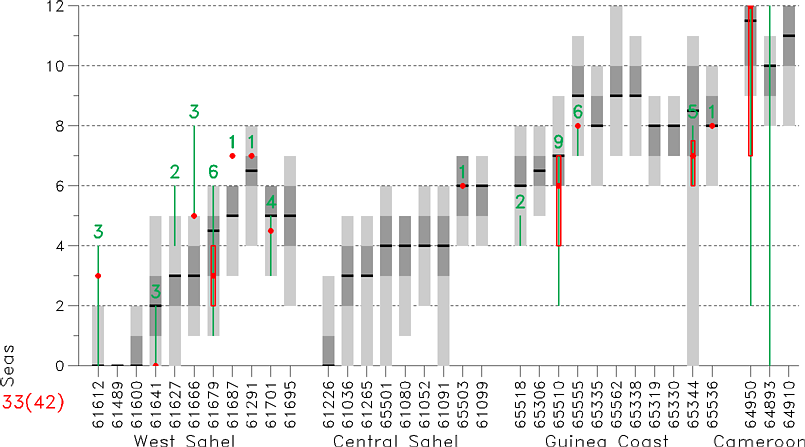
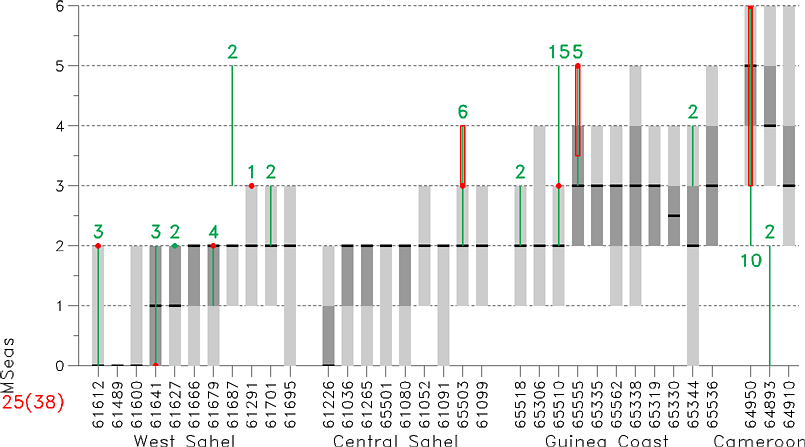
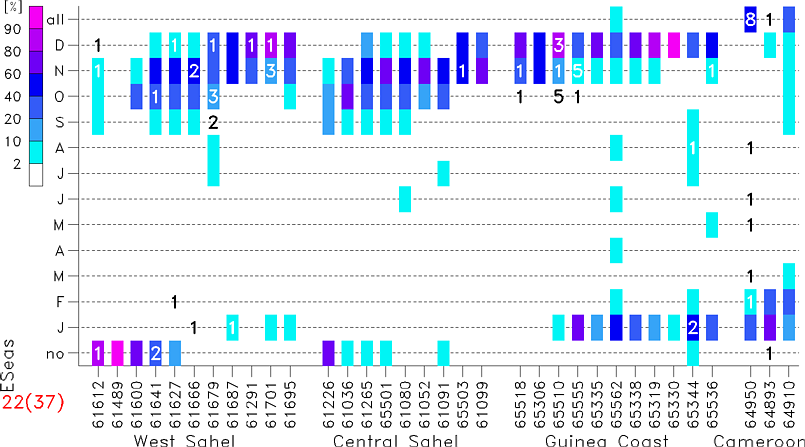
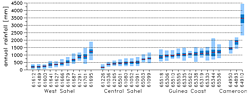
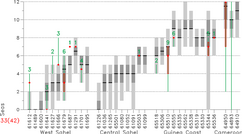
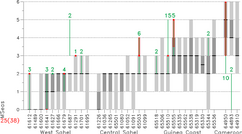
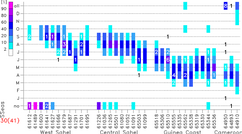
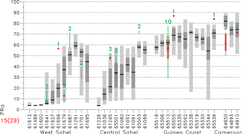
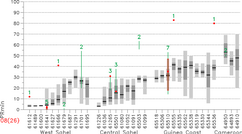
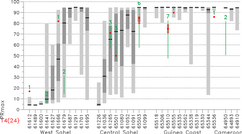
Fig. 1:
Validation of the LMM simulation of ten different entomological and parasitological variables.
The simulated data are compared to observed values of
various entomological malaria field studies. The data of the LMM simulations
are provided for the median (black mark), the range of the 25 to 75 percentile (dark grey area), and
for the absolute values (light grey area). In addition, the observations are displayed either as
a single dot, a vertical line between two available data points, a verticle line
with a single dot (three values), or as a box-whisker plot (more than three data points). Moreover,
the number of observations is either given above or below the inserted observed data.
In the case of the start and end of the transmission season (SSeas and ESeas) for each particular month
a frequency distribution with regard to the 34 years between 1973 and 2006 is given. Additionly, the
frequency of years with no ("no") or year-around ("all") transmission is illustrated. The number of
correspondent observations are inserted as a digit.
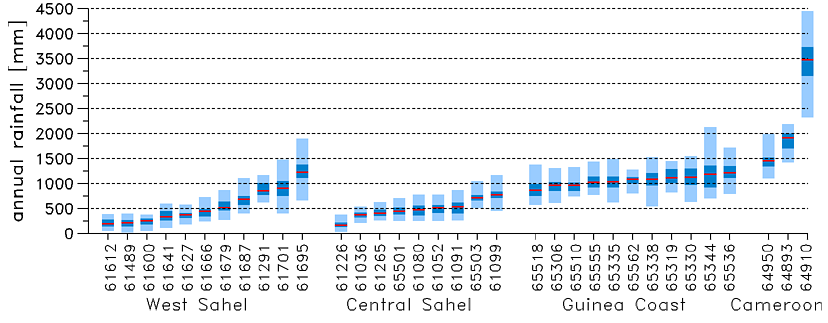
Additionly the annual rainfall amount (RRa) of the synoptic stations is given
(red mark: median; dark blue area: 25 to 75 percentile; light blue area: absolute values).
The daily rainfall data from these stations was used to force the LMM.
| Country | Name | Identifier | Latitude | Longitude | Elevation [m] |
|---|
| Niger | Tillabéry | 61036 | 14°12'N | 1°27'E | 210 |
| Niger | Niamey | 61052 | 13°29'N | 2°10'E | 227 |
| Niger | Maradi | 61080 | 13°28'N | 7°05'E | 373 |
| Niger | Magaria | 61091 | 12°59'N | 8°56'E | 403 |
| Niger | Gaya | 61099 | 11°53'N | 3°27'E | 203 |
| Mali | Gao | 61226 | 16°16' | 0°03'W | 260 |
| Mali | Mopti Barbe (Mil) | 61265 | 14°31'N | 4°06'W | 272 |
| Mali | Bamako Senou | 61291 | 12°32'N | 7°57'W | 381 |
| Mauritania | Rosso | 61489 | 16°30'N | 15°49'W | 6 |
| Senegal | Saint Louis | 61600 | 16°03'N | 16°27'W | 4 |
| Senegal | Podor | 61612 | 16°39'N | 14°58'W | 7 |
| Senegal | Linguère | 61627 | 15°23'N | 15°07'W | 21 |
| Senegal | Dakar Yoff | 61641 | 14°44'N | 17°30'W | 24 |
| Senegal | Diourbel | 61666 | 14°39'N | 16°14'W | 9 |
| Senegal | Kaolack | 61679 | 14°08'N | 16°04'W | 7 |
| Senegal | Tambacounda | 61687 | 13°46'N | 13°41'W | 50 |
| Senegal | Ziguinchor | 61695 | 12°33'N | 16°16'W | 23 |
| Gambia, The | Banjul Yundum | 61701 | 13°21'N | 16°48'W | 33 |
| Cameroon | Koundja Foumban | 64893 | 5°39'N | 10°45'E | 1210 |
| Cameroon | Douala | 64910 | 4°00'N | 9°44'E | 9 |
| Cameroon | Yaoundé | 64950 | 3°50'N | 11°31'E | 760 |
| Benin | Kandi | 65306 | 11°08'N | 2°56'E | 292 |
| Benin | Natitingou | 65319 | 10°19'N | 1°23'E | 461 |
| Benin | Parakou | 65330 | 9°21'N | 2°37'E | 393 |
| Benin | Savé | 65335 | 8°02'N | 2°29'E | 200 |
| Benin | Bohicon | 65338 | 7°10'N | 2°04'E | 166 |
| Benin | Cotonou | 65344 | 6°21'N | 2°23'E | 9 |
| Burkina_Faso | Dori | 65501 | 14°02'N | 0°02'W | 277 |
| Burkina_Faso | Ouagadougou | 65503 | 12°21'N | 1°31'W | 306 |
| Burkina_Faso | Bobo-Dioulasso | 65510 | 11°10'N | 4°19'W | 460 |
| Burkina_Faso | Po | 65518 | 11°09'N | 1°09'W | 322 |
| Burkina_Faso | Korhogo | 65536 | 9°25'N | 5°37'W | 381 |
| Côte d'Ivoire | Bouaké | 65555 | 7°44'N | 5°04'W | 376 |
| Côte d'Ivoire | Dimbokro | 65562 | 6°39'N | 4°42'W | 92 |
Tab. 1:
Information regarding the meteorological stations along the transect at about 2°E
as well as other African weather stations. The names, identifiers, latitude and longitude positions
as well as the elevation (in m) of the used meteorological stations are given. The daily mean temperature
and daily precipitation accumulation of these meteorological stations was used to force the LMM for the
period 1973 to 2006.
|
|