| figure, table | reference | variable | location | area | position | period (YYY1M1-YYY2M2) | mosquito species | note |
|---|
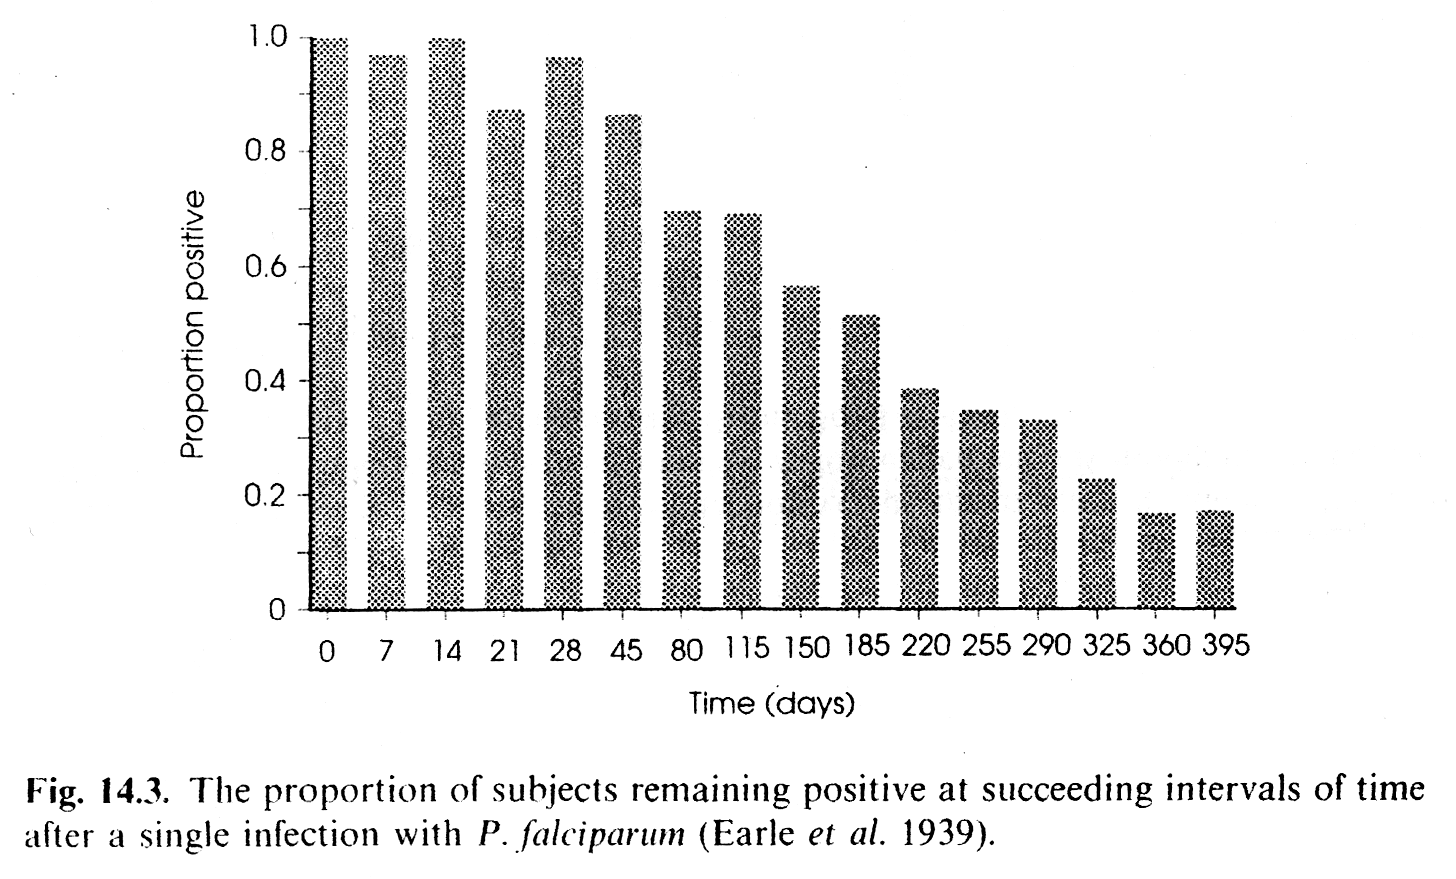
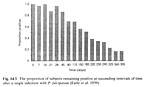 | Anderson and May 1991 (fig. 14.3) | proportion of subjects remaining malaria infectious | Puerto Rico | - | - | - | - | study of Earle et al. (1939) |
|---|
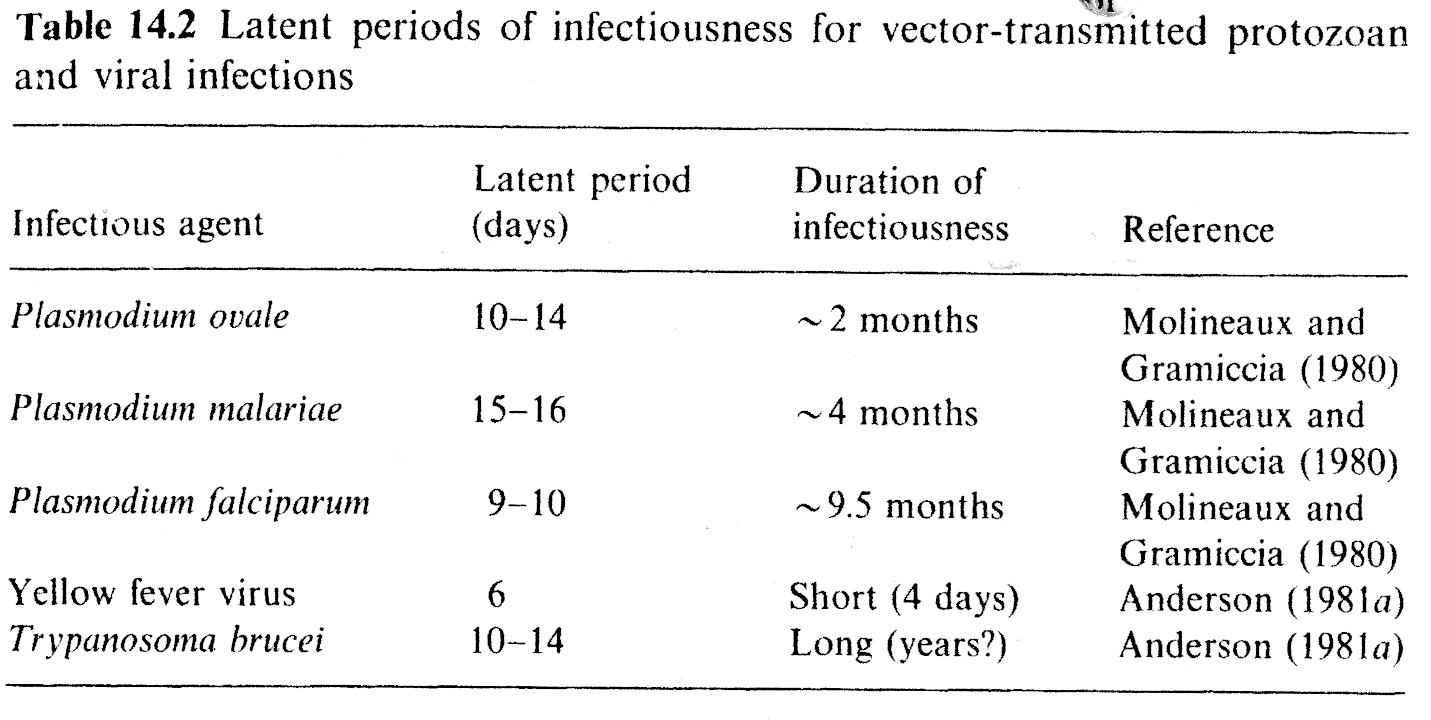
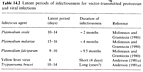 | Anderson and May 1991 (tab. 14.2) | latent period and duration of infectiousness | - | - | - | - | - | - |
|---|
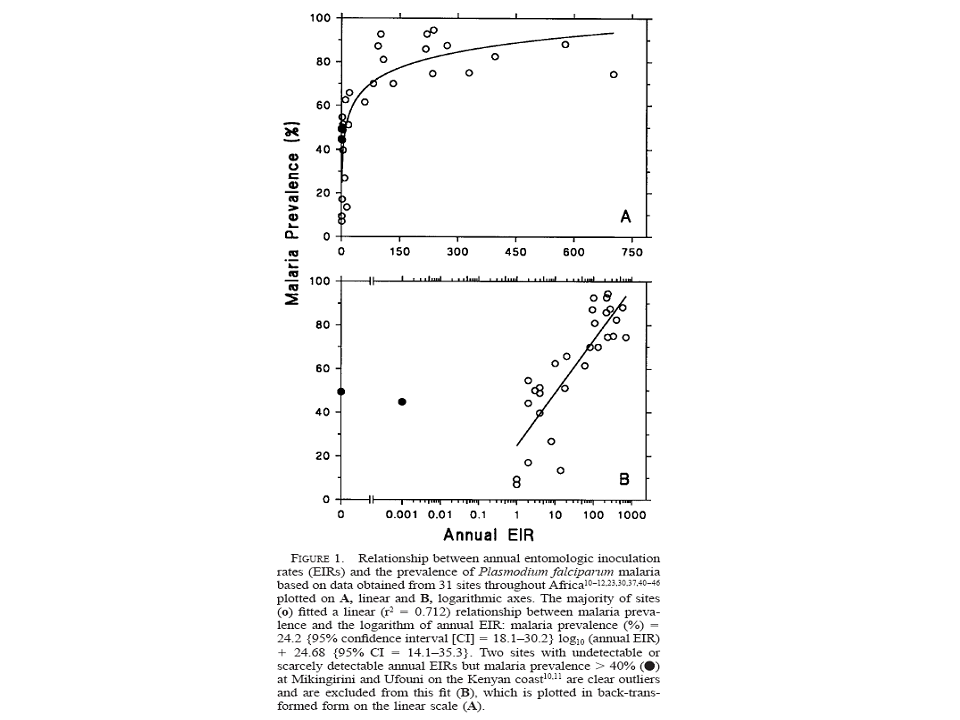
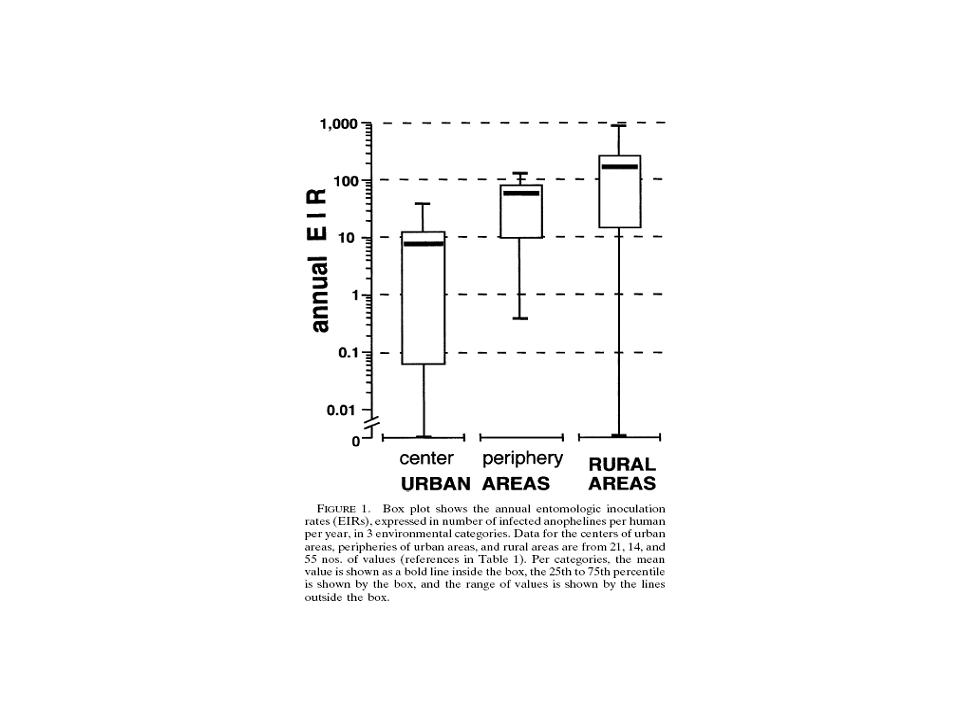
 | Beier et al. 1999 (fig. 1) | PR, EIRa | - | - | - | - | - | - |
|---|
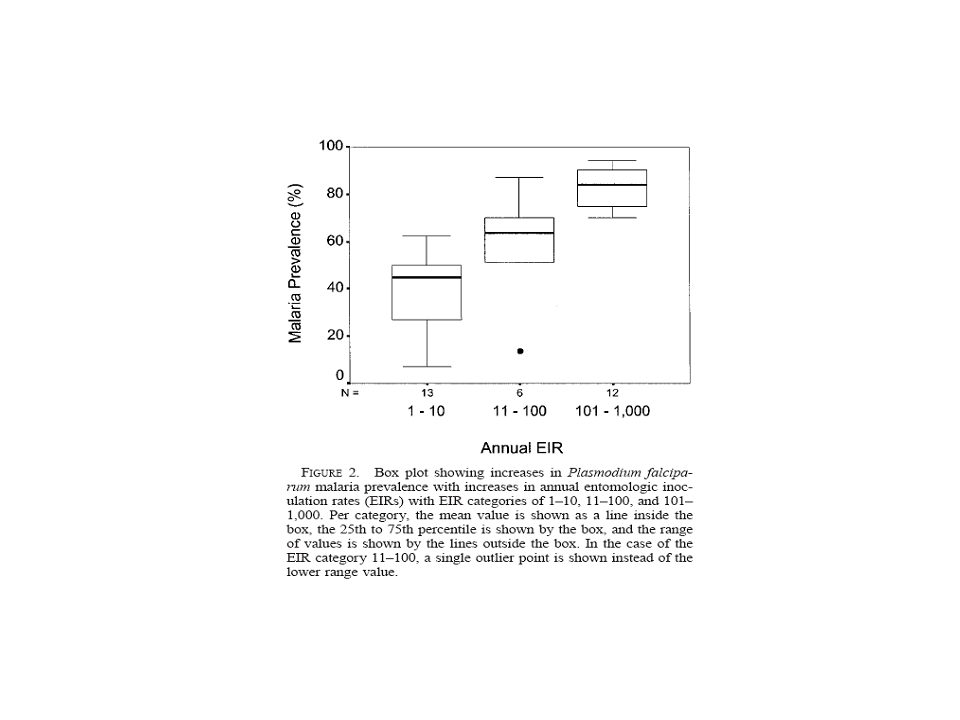
 | Beier et al. 1999 (fig. 2) | PR, EIRa categories | - | - | - | - | - | - |
|---|
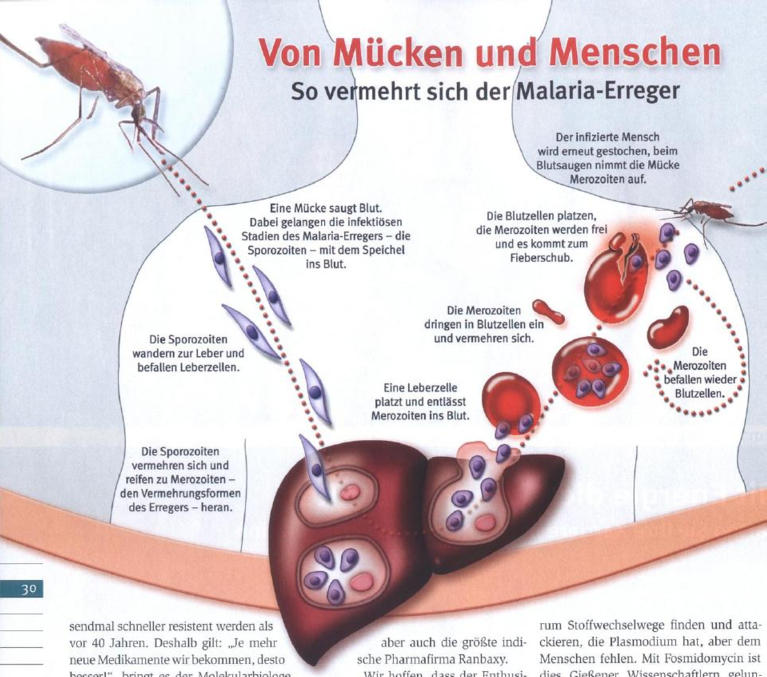
 | Bild Der Wissenschaft 2006 (fig. 2a) | malaria parasite cycle | - | - | - | - | - | - |
|---|
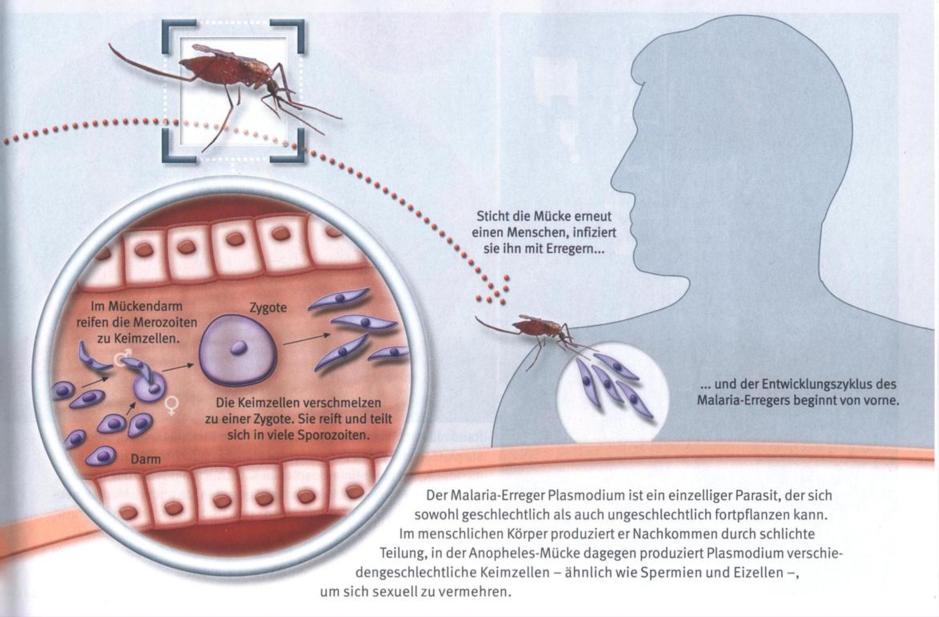
 | Bild Der Wissenschaft 2006 (fig. 2b) | malaria parasite cycle | - | - | - | - | - | - |
|---|
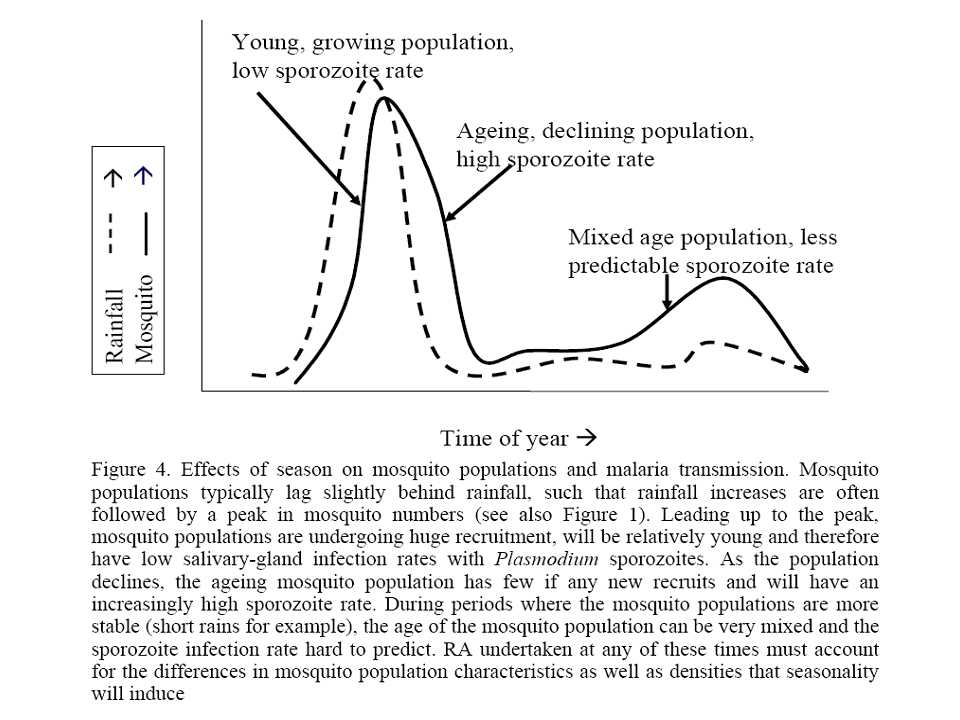
 | Billingsley et al. 2005 (fig. 4) | RR & MOSQ | - | - | - | - | - | sketch |
|---|
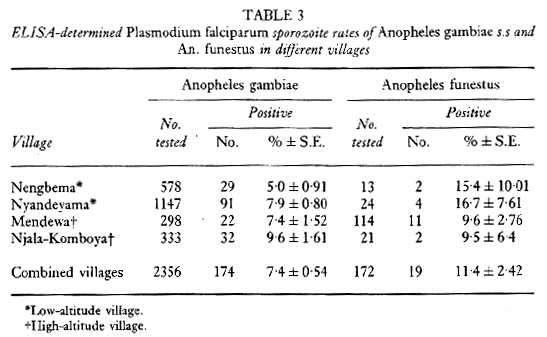
 | Bockarie et al. 1994 (tab. 3) | CSPRa | Sierra Leone | 4 villages in Bo district | see Bockarie et al (1993a); - , -, - , - | 199001-199104 | Anopheles gambiae sensu stricto, Anopheles funestus | ??mean of high/low altitude villages |
|---|
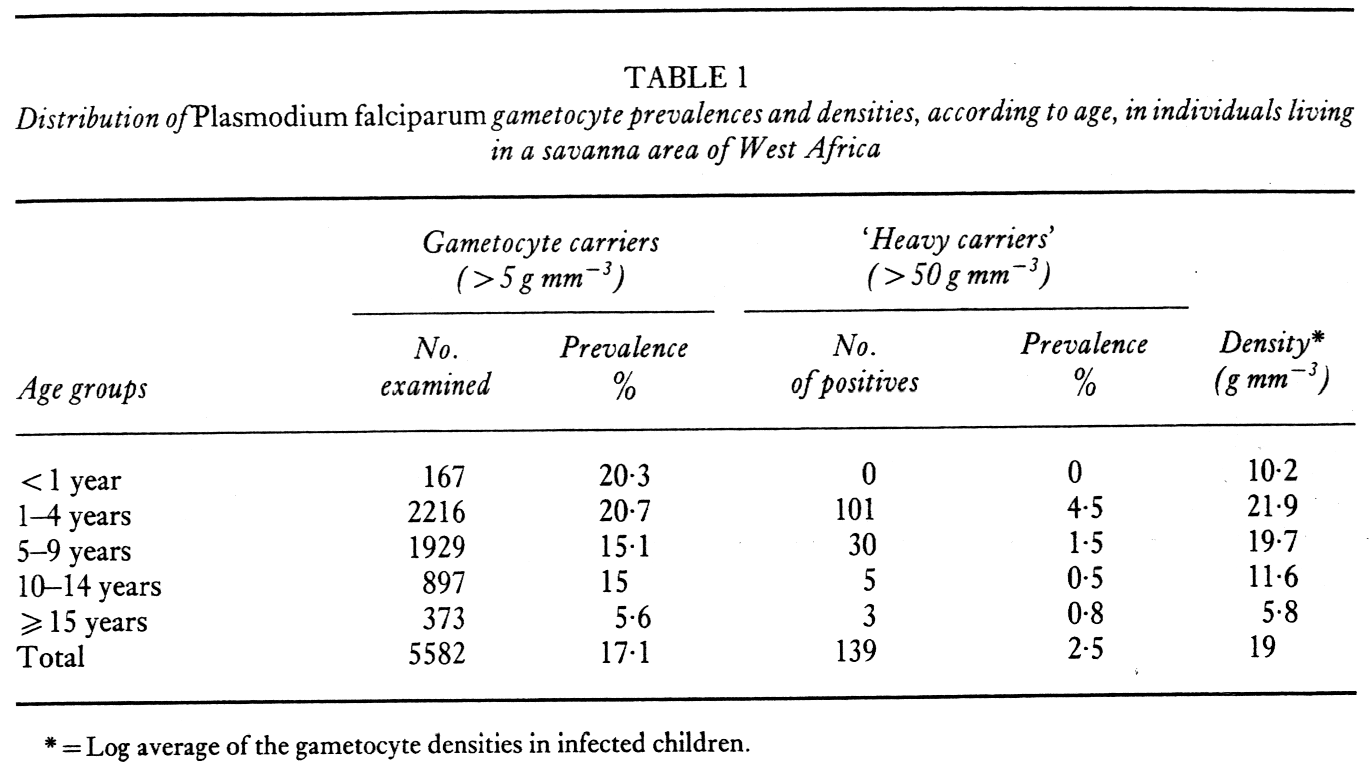
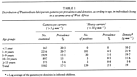 | Boudin et al. 1991a (tab. 1) | gametocyte prevalences and densities according to age classes | Burkina Faso | Bobo-Dioulasso | 11°12'N, 4°18'W† | 1985 to 1987 | - | savanna area |
|---|
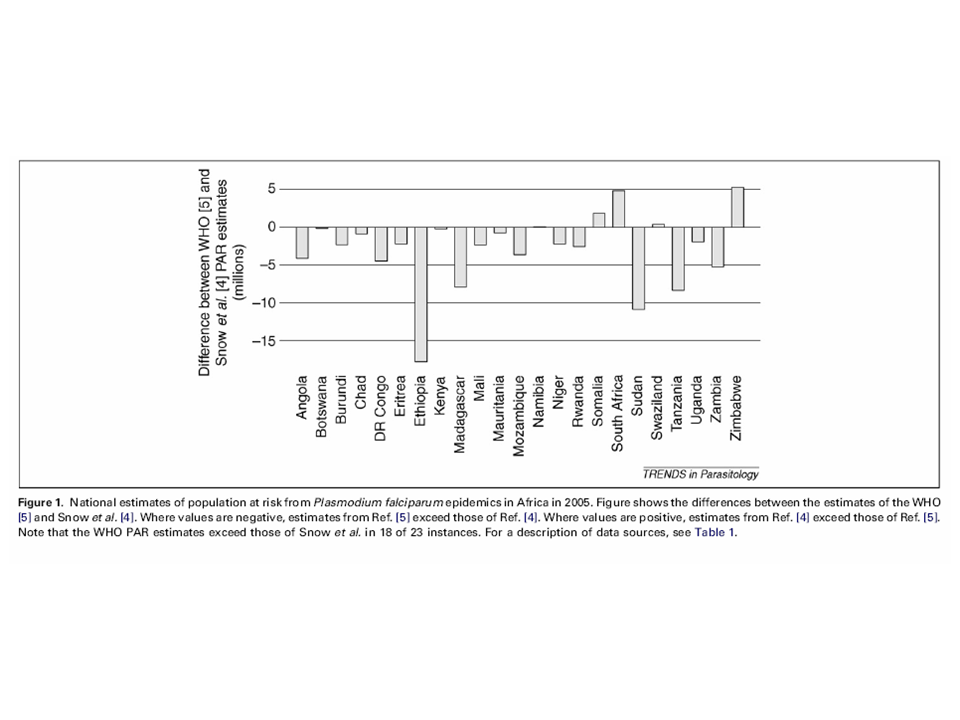
 | Cox et al. 2007 (fig. 1) | estimates of populations of risk from malaria epidemics | Africa | - | - | - | - | - |
|---|
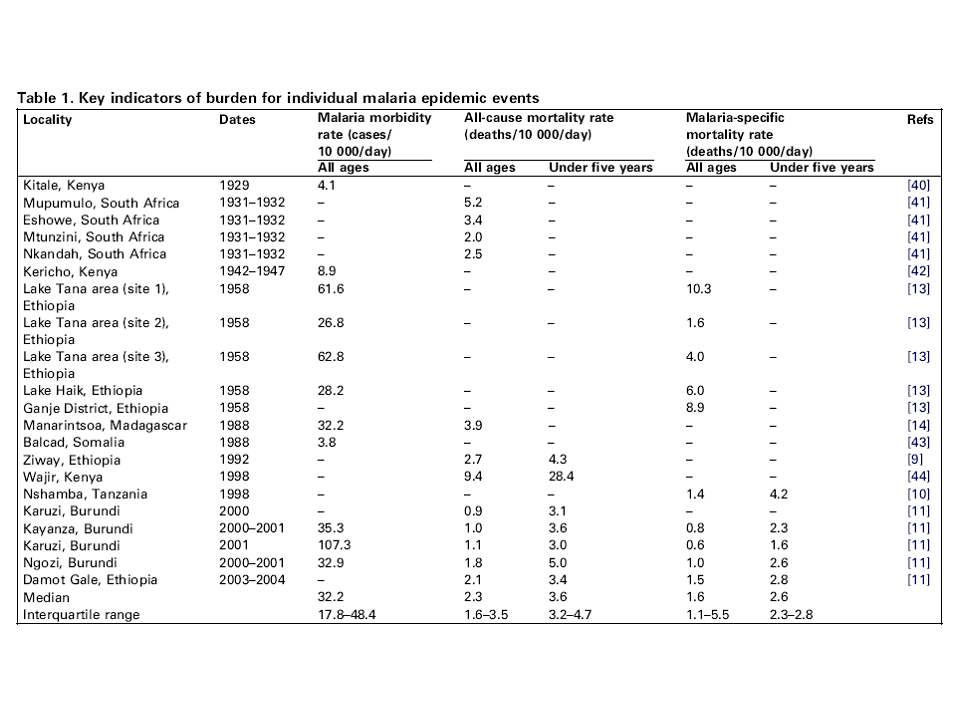
 | Cox et al. 2007 (tab. 1) | statistics regarding malaria epidemics | Africa | - | - | - | - | - |
|---|
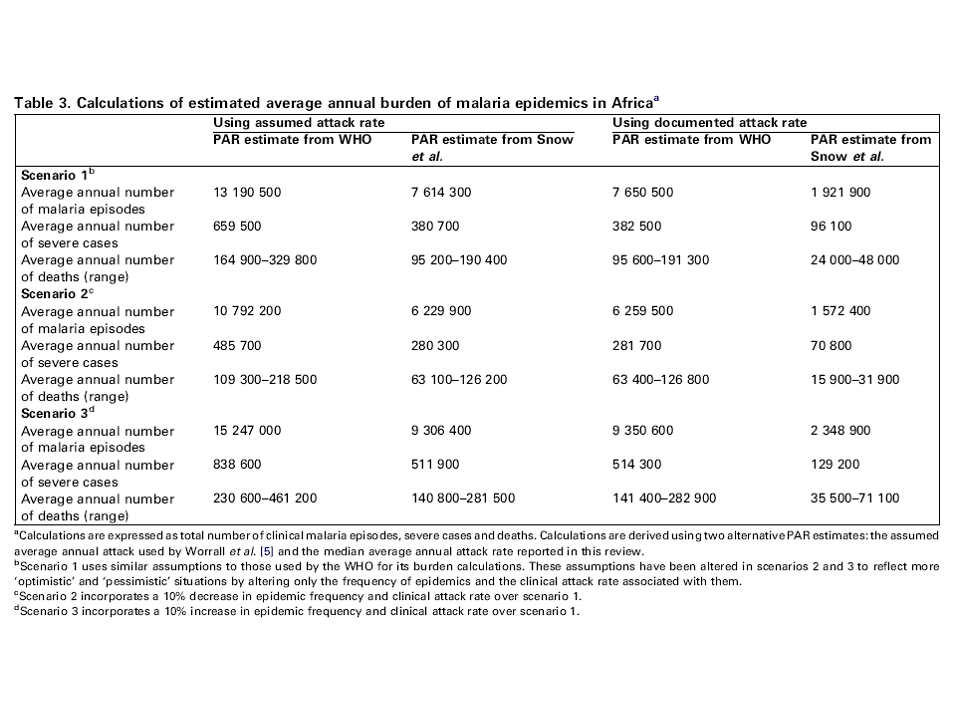
 | Cox et al. 2007 (tab. 3) | calculations of estimated annual burden of malaria epidemics | Africa | - | - | - | - | - |
|---|
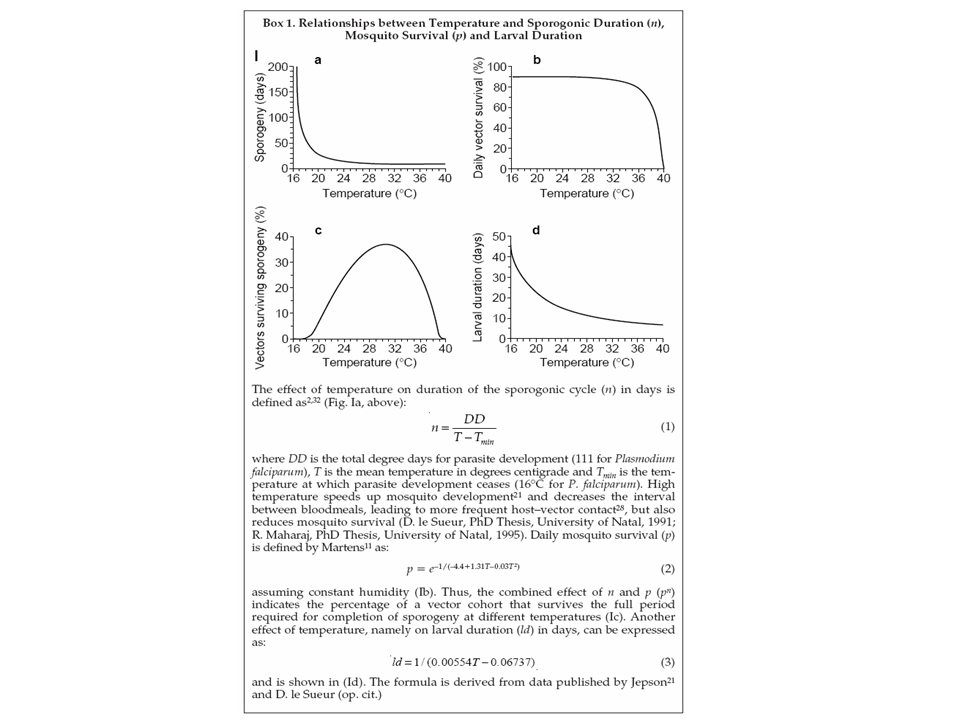
 | Craig et al. 1999 Box1) | duration sporogonic cycle, pd, vectors surviving sporogony, larval survival | - | - | - | - | - | Martens (1997) pd formula |
|---|
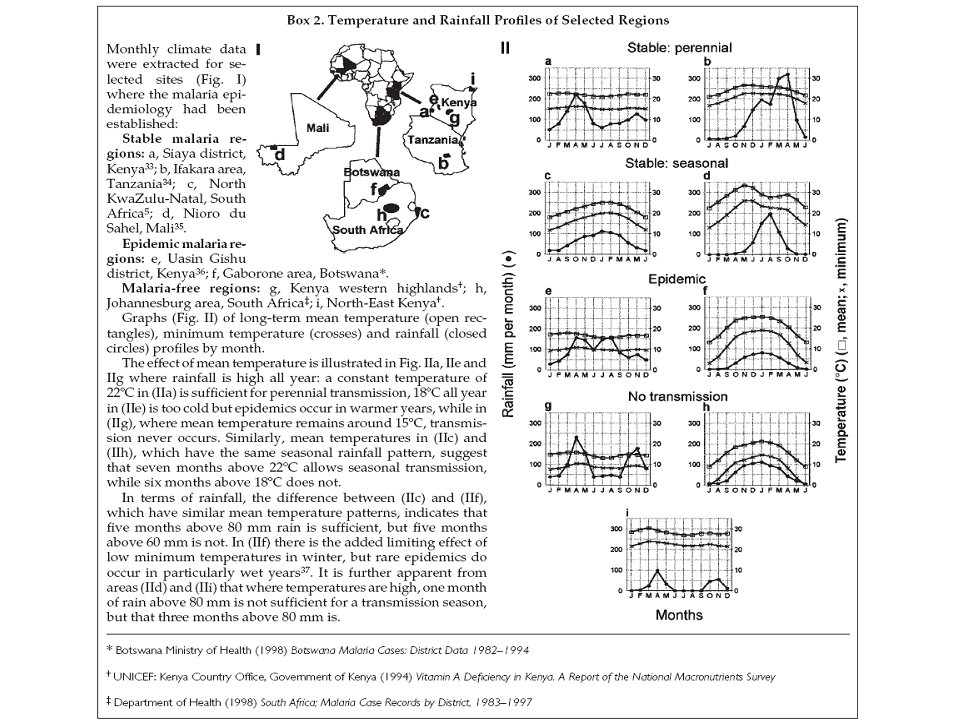
 | Craig et al. 1999 Box2) | RRm, Tmin, Tmax | - | - | - | - | - | climate characteristics of stable, epidemic malaria and malaria free regions |
|---|
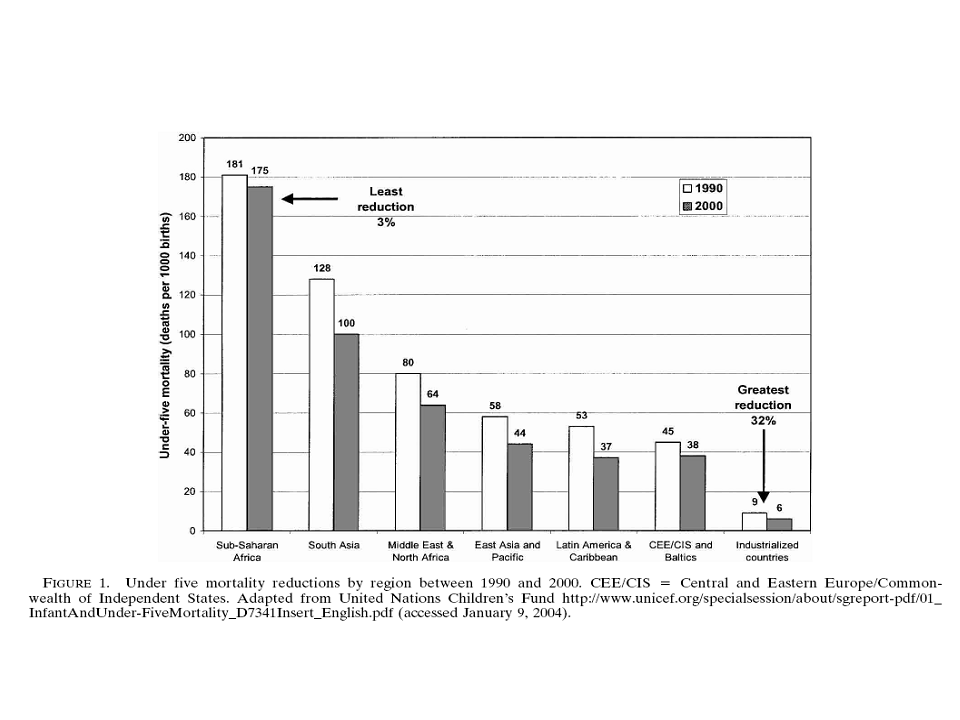
 | De Savigny and Binka 2004 (fig. 1) | MALD | world | - | - | 1990, 2000 | - | children under five |
|---|
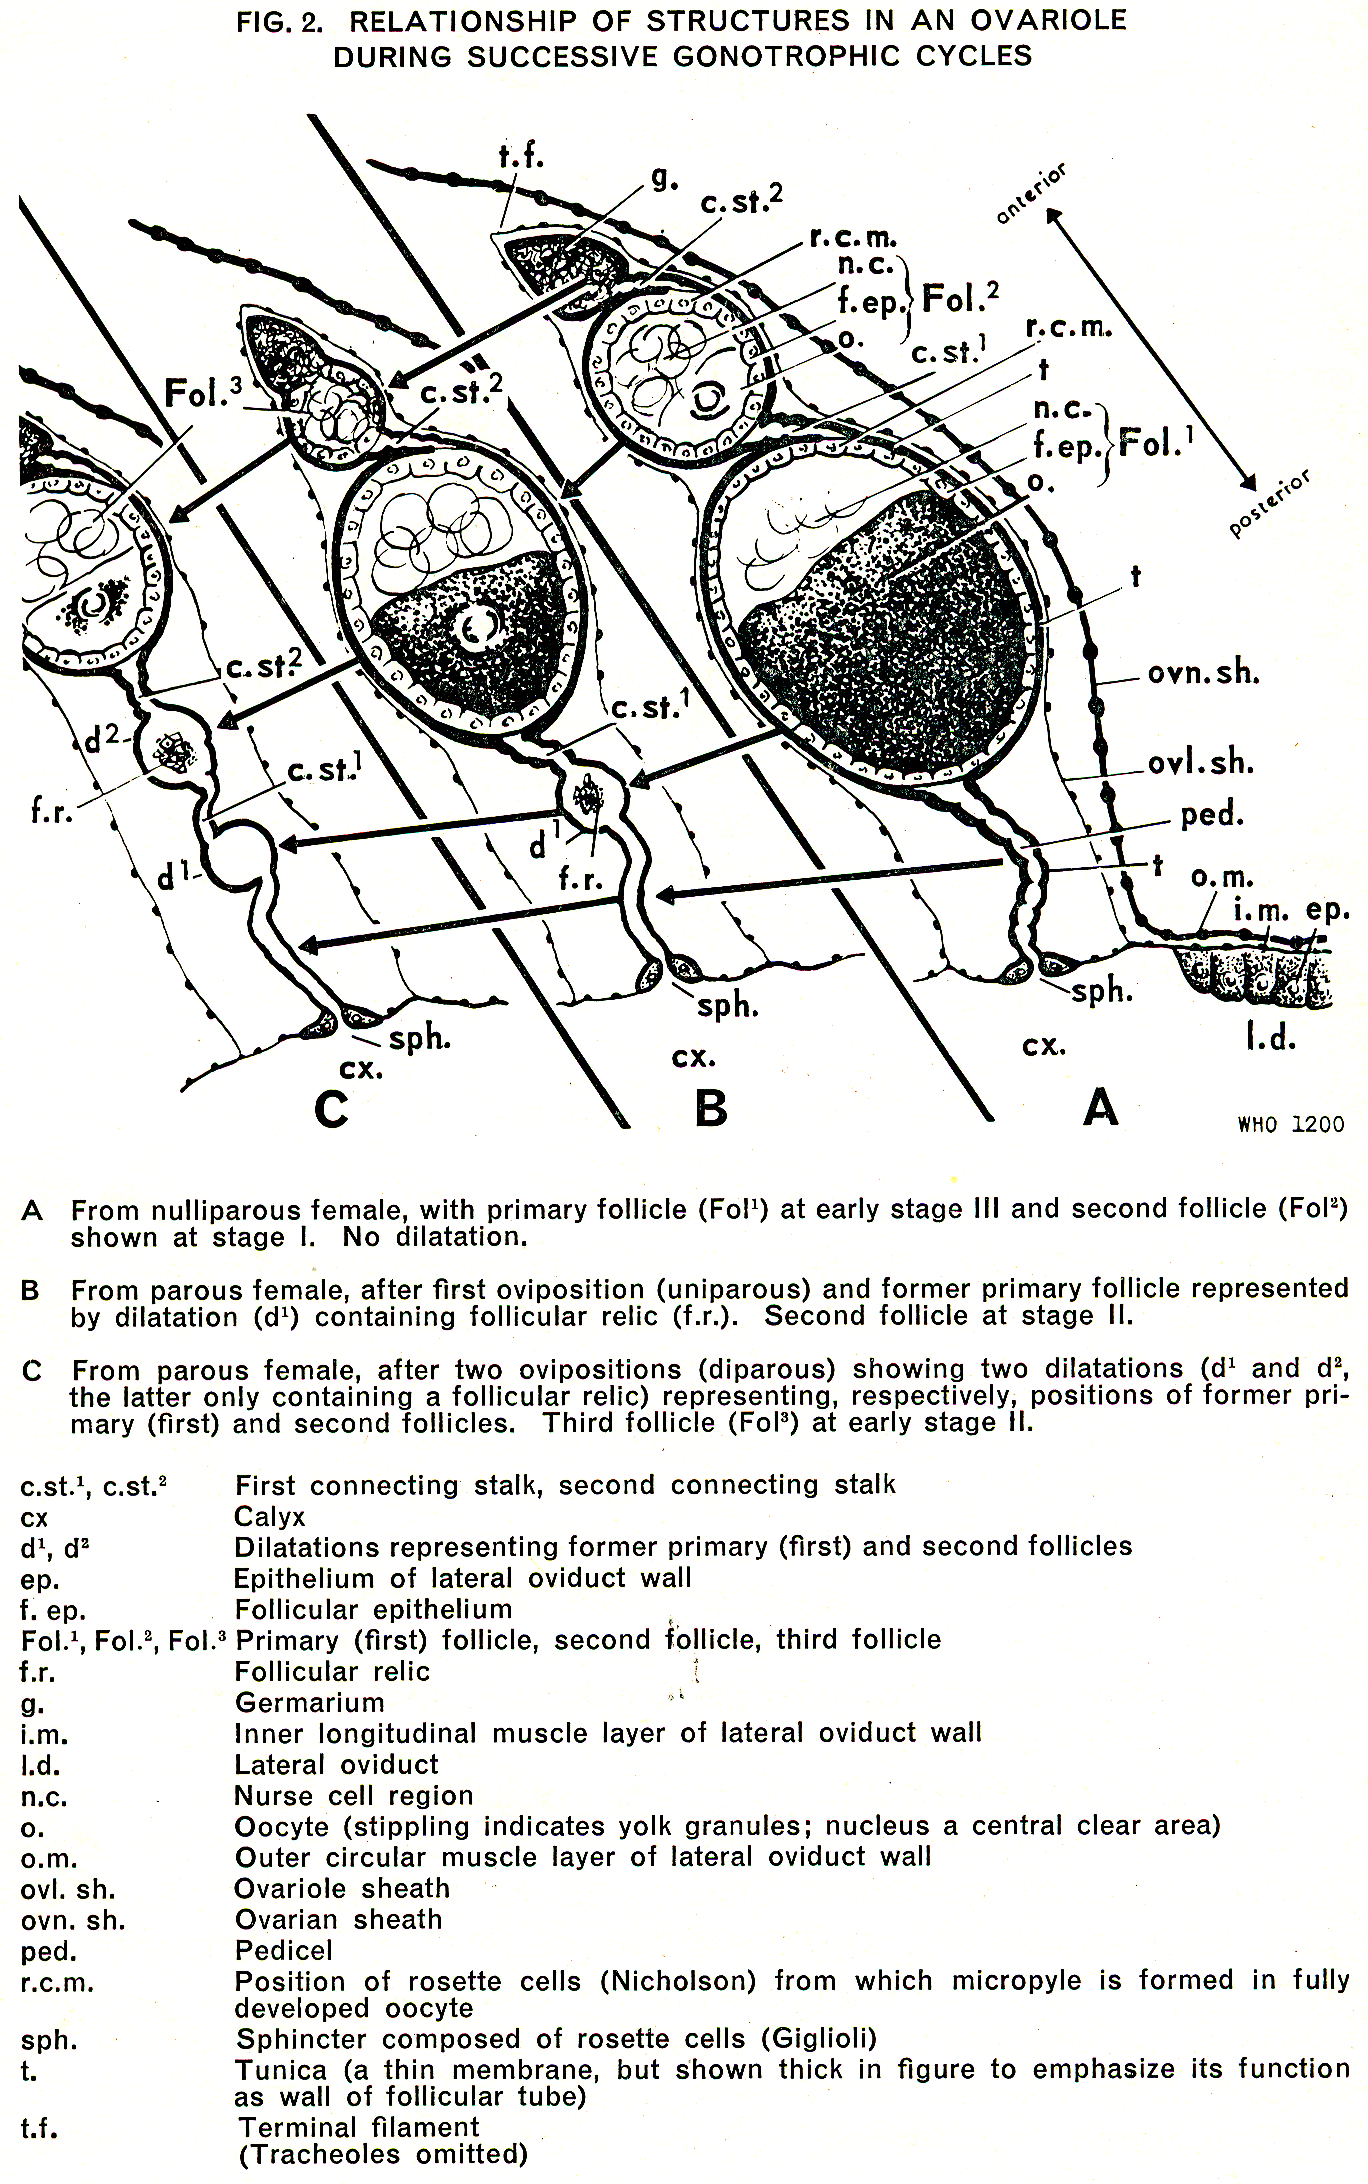
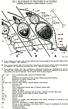 | Detinova 1962 Annexfig2) | structures in an ovariole during successive gonotrophic cycles | - | - | - | - | - | - |
|---|
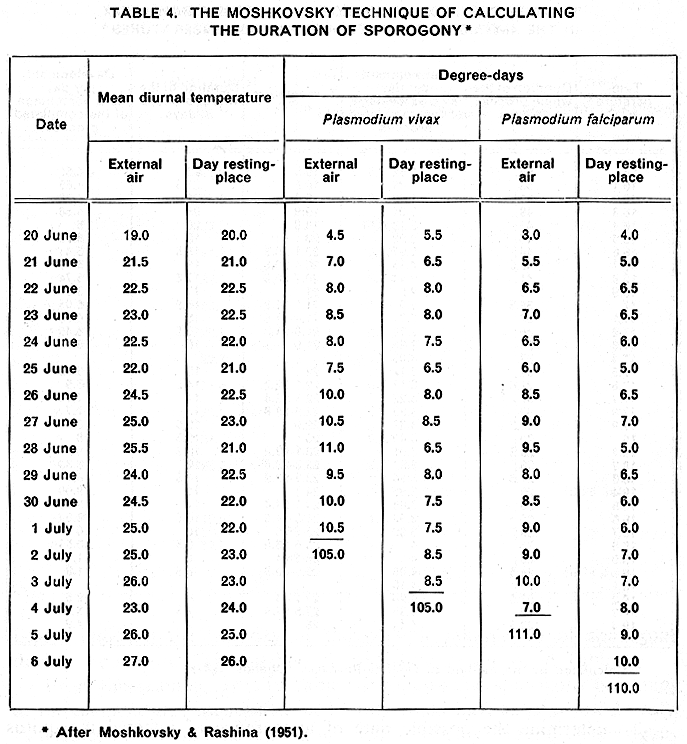
 | Detinova 1962 (tab. 4) | calculation of the duration of the sporogonic cycle | - | - | - | - | - | - |
|---|
 | Dietz et al. 1974 (tab. 2) | malaria variables | Nigeria | Kano State | 12°N, 8°30E | - | - | - |
|---|
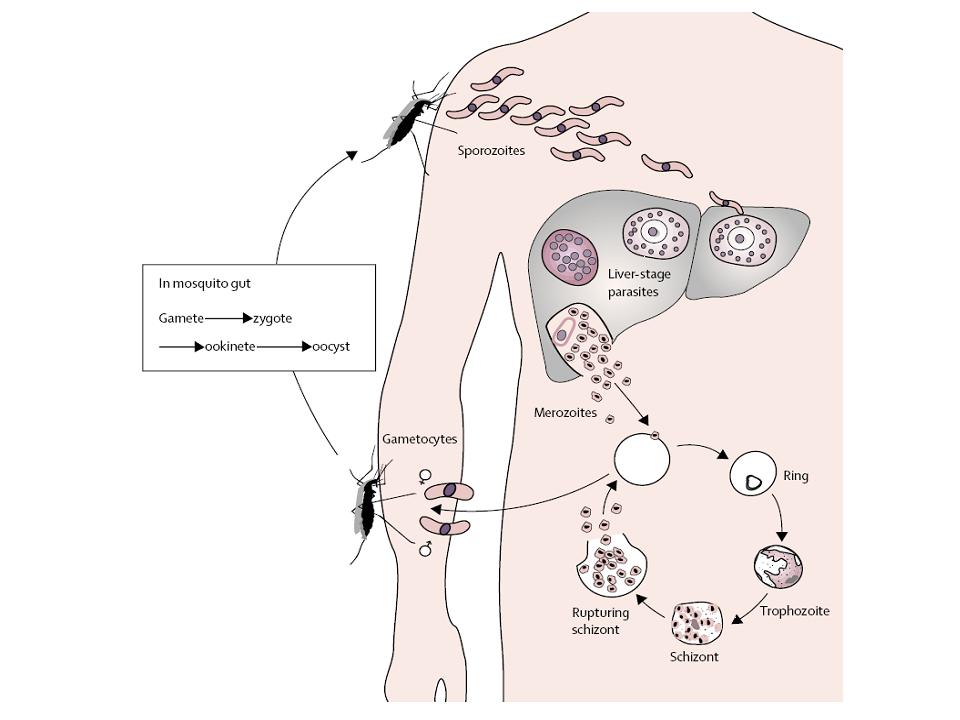
 | Greenwood et al. 2005 (fig. 1) | malaria parasite cycle | - | - | - | - | - | - |
|---|
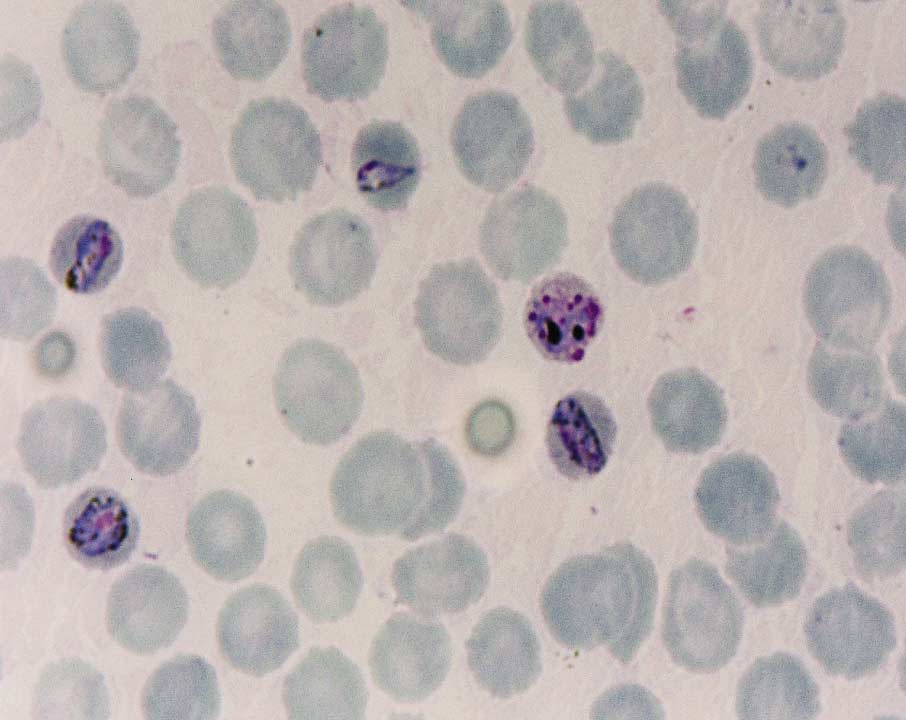
 | Greenwood et al. 2005 (fig. 4) | merozoites ring stage | - | - | - | - | - | microscope photo |
|---|
 | Gubler 1998 (fig. 2) | CMCa, CMCm | - | Sri Lanka, India, Korea, Manaus | - | - | - | evolution of the worldwide malaria situation |
|---|
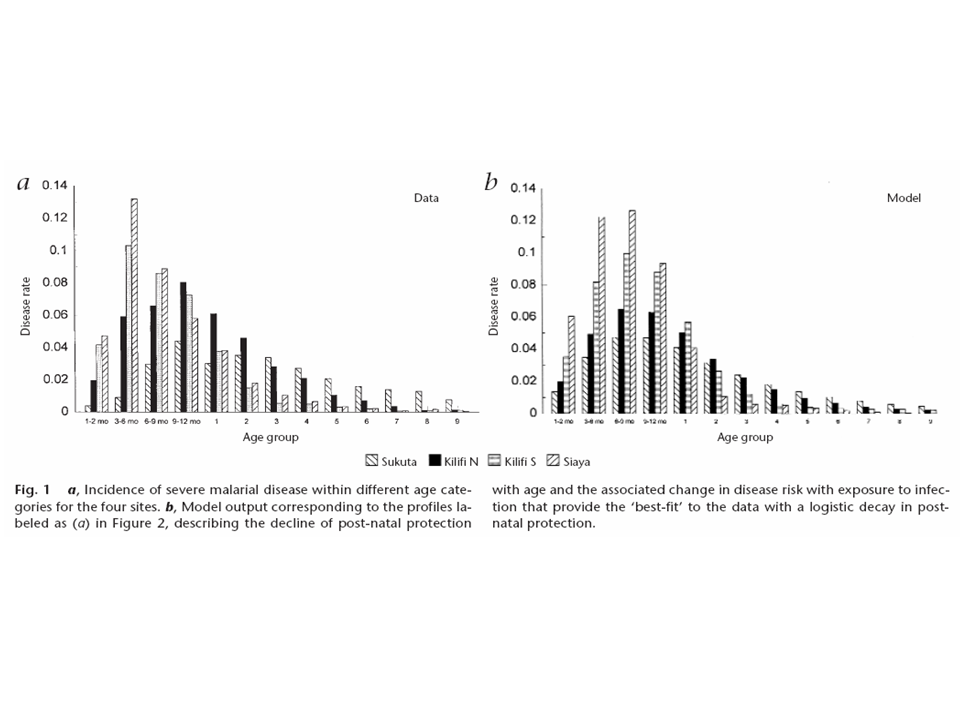
 | Gupta et al. 1999 (fig. 1) | CMC | The Gambia, Kenya | Sukuta, Kilifi, Siaya | - | - | - | age categories; z(Sukuta)<35†, z(Kilifi)=1†, z(Siaya)=1224† |
|---|
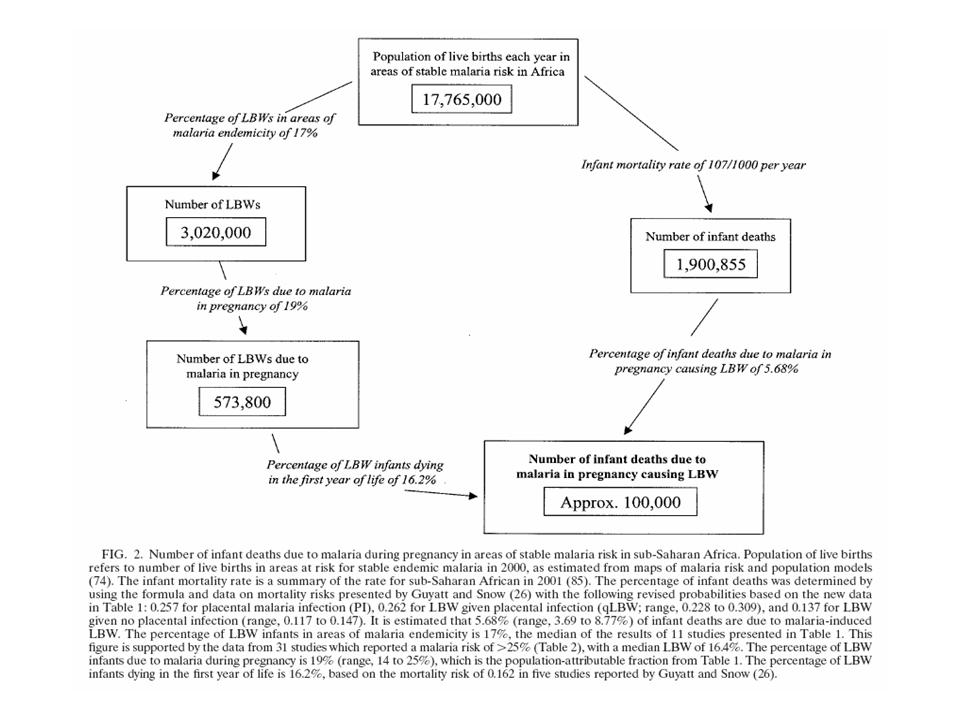
 | Guyatt and Snow 2004 (fig. 2) | numbers of low birth weight due to malaria | sub-Saharan Africa | - | - | 2000, 2001 | - | flow chart |
|---|
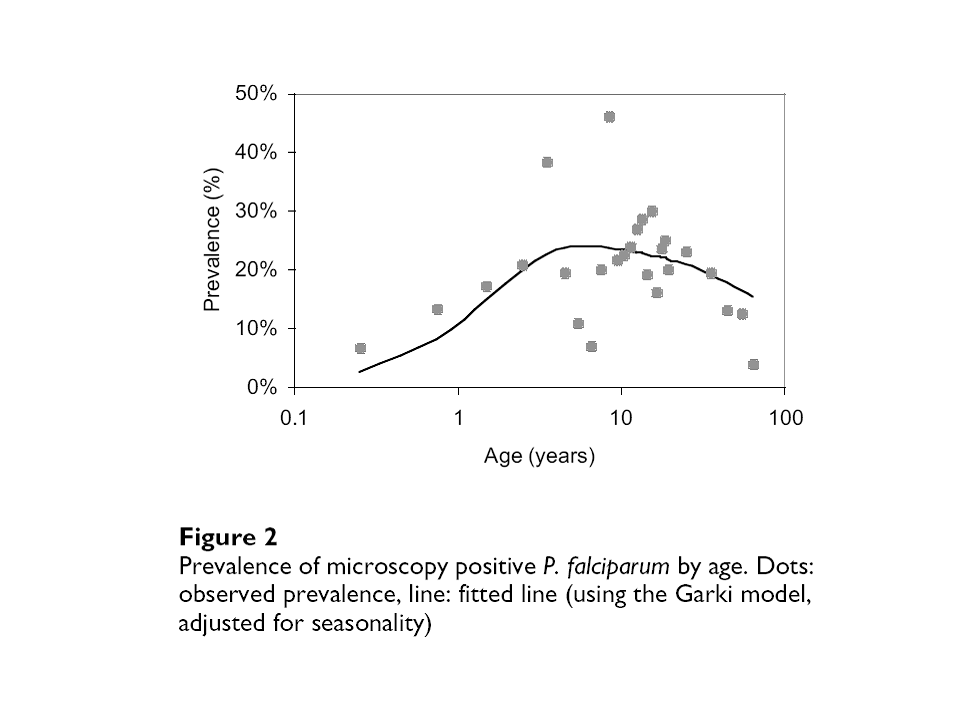
 | Hagmann et al. 2003 (fig. 2) | PR according to different ages | Principe | - | 1°35'N, 7°25'E | 199905-199908 | - | - |
|---|
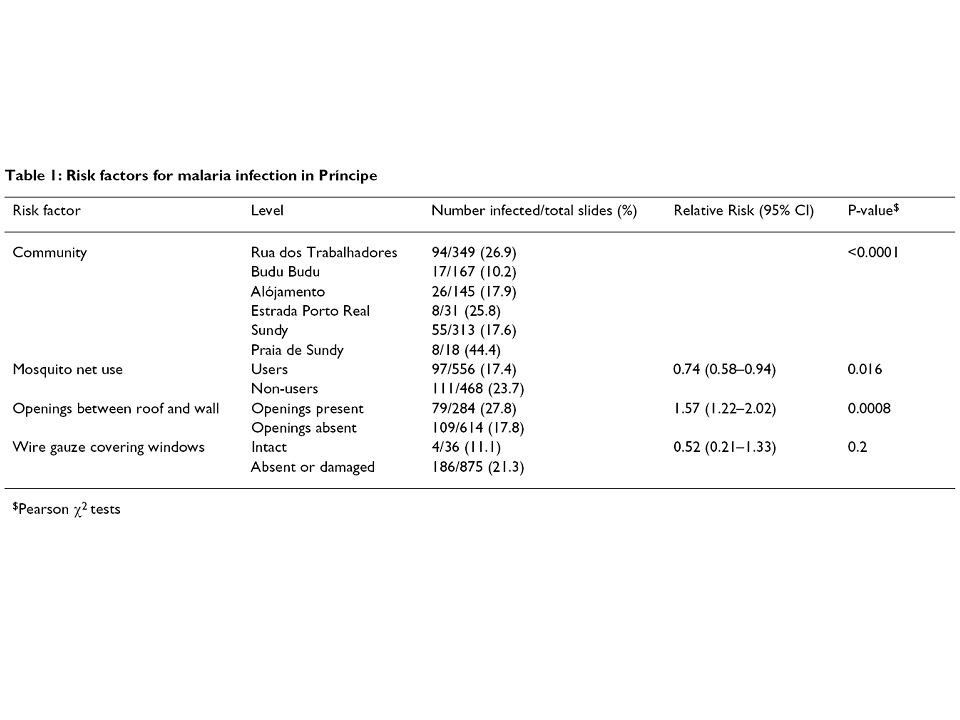
 | Hagmann et al. 2003 (tab. 1) | risk factors for malaria infection | Principe | - | 1°35'N, 7°25'E | 199905-199908 | - | - |
|---|
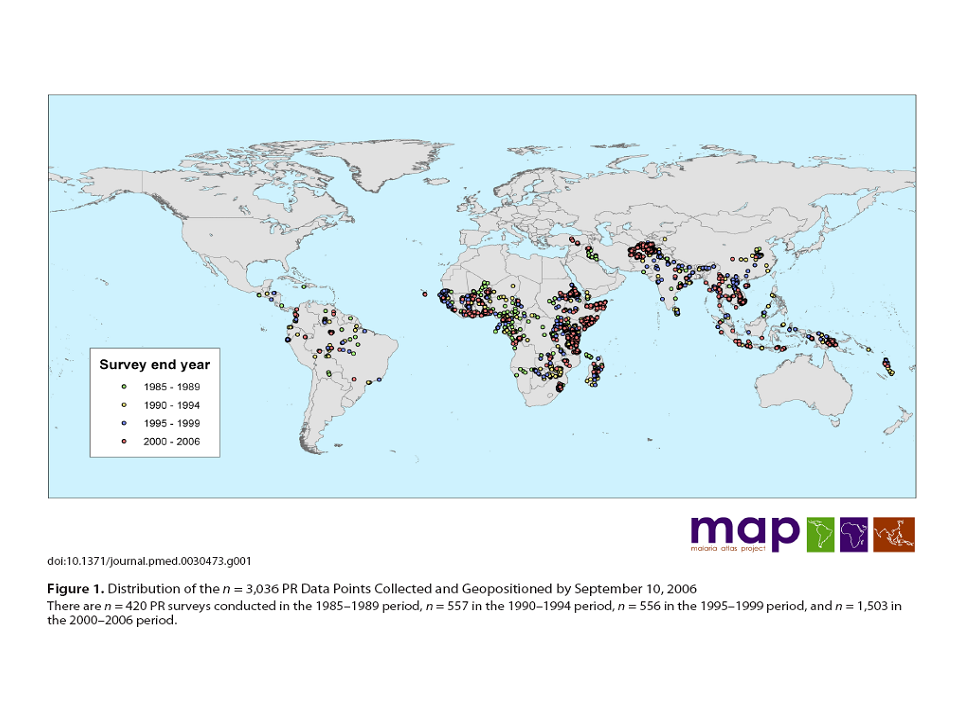
 | Hay and Snow 2006 (fig. 1) | collected survey data | world | - | - | - | - | malaria atlas project |
|---|
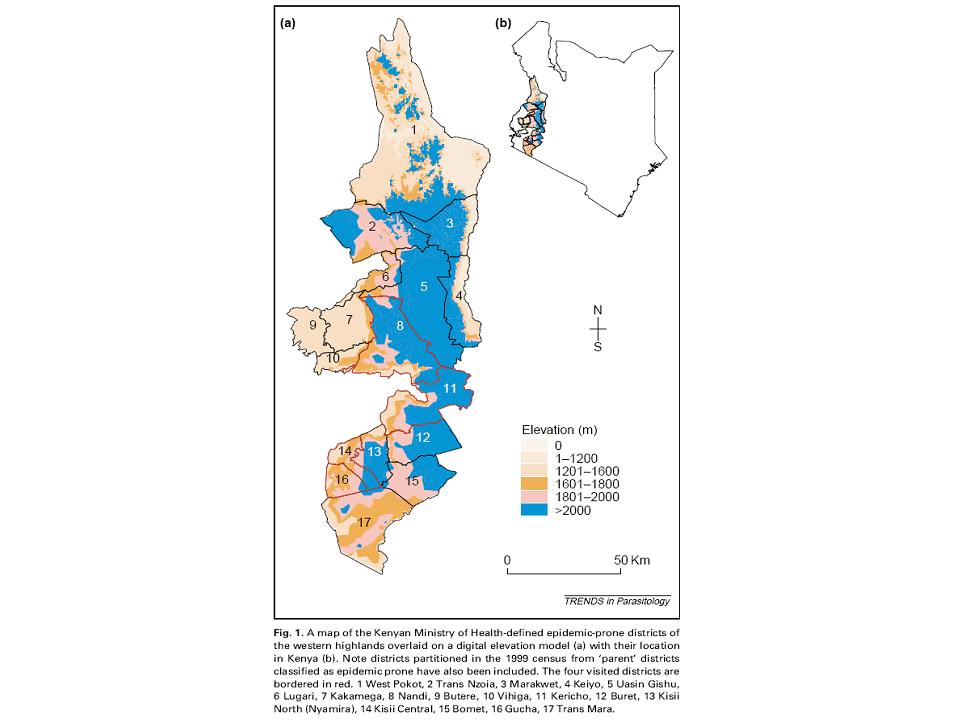
 | Hay et al. 2003a (fig. 1) | epidemic-prone districts | Kenya | districts | - | - | - | - |
|---|
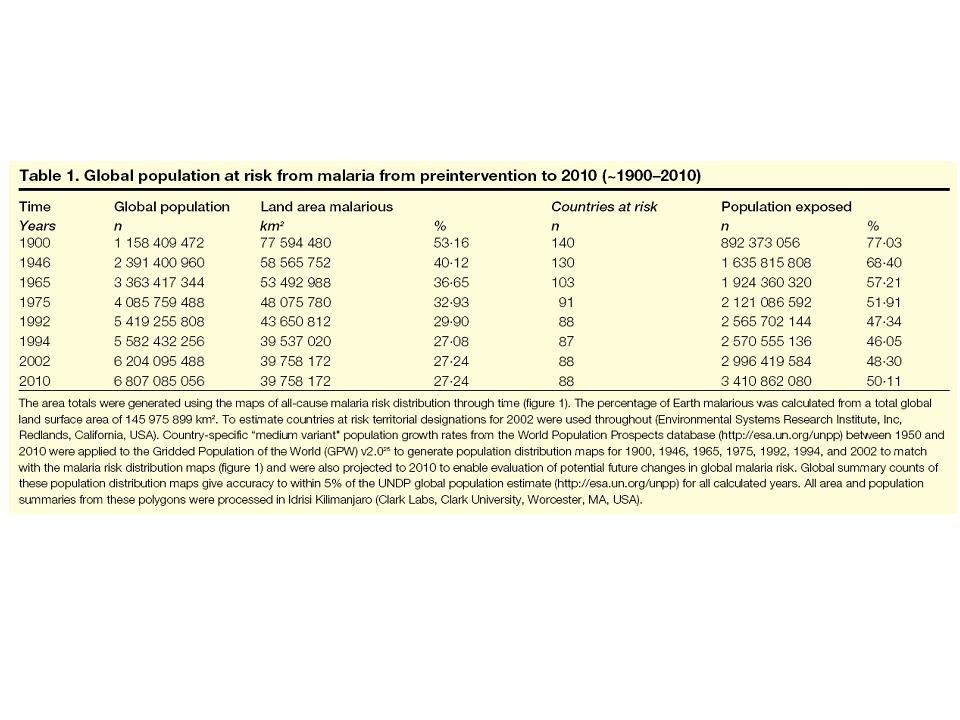
 | Hay et al. 2004 (tab. 1) | population at risk from malaria | world | - | - | 1900 to 2010 | - | - |
|---|
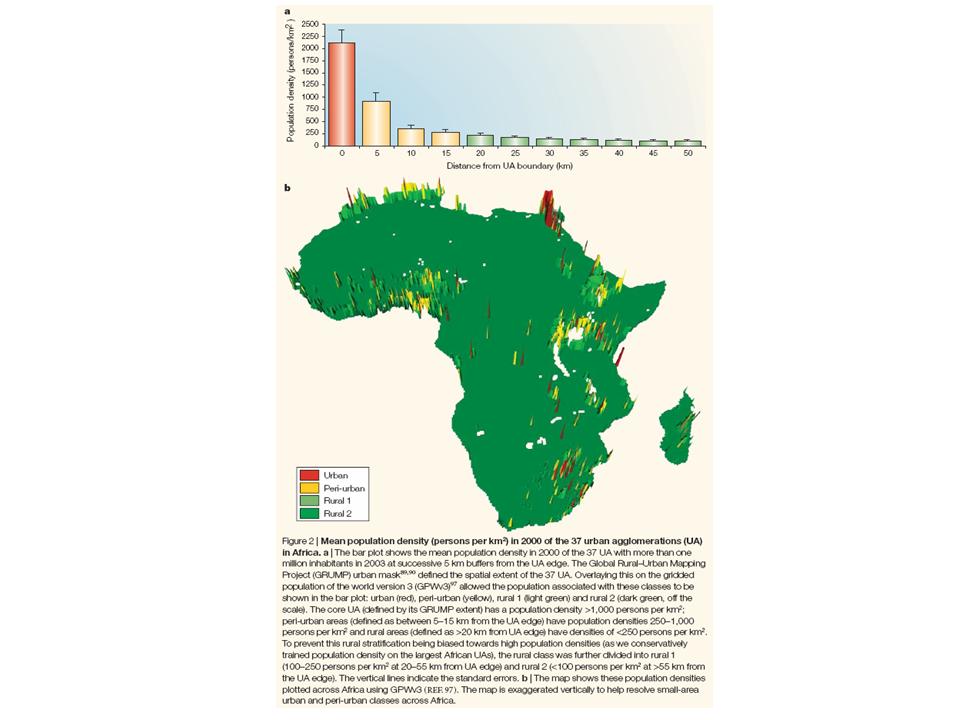
 | Hay et al. 2005a (fig. 2) | population density | Africa | - | - | 2000 | - | rural, urban |
|---|
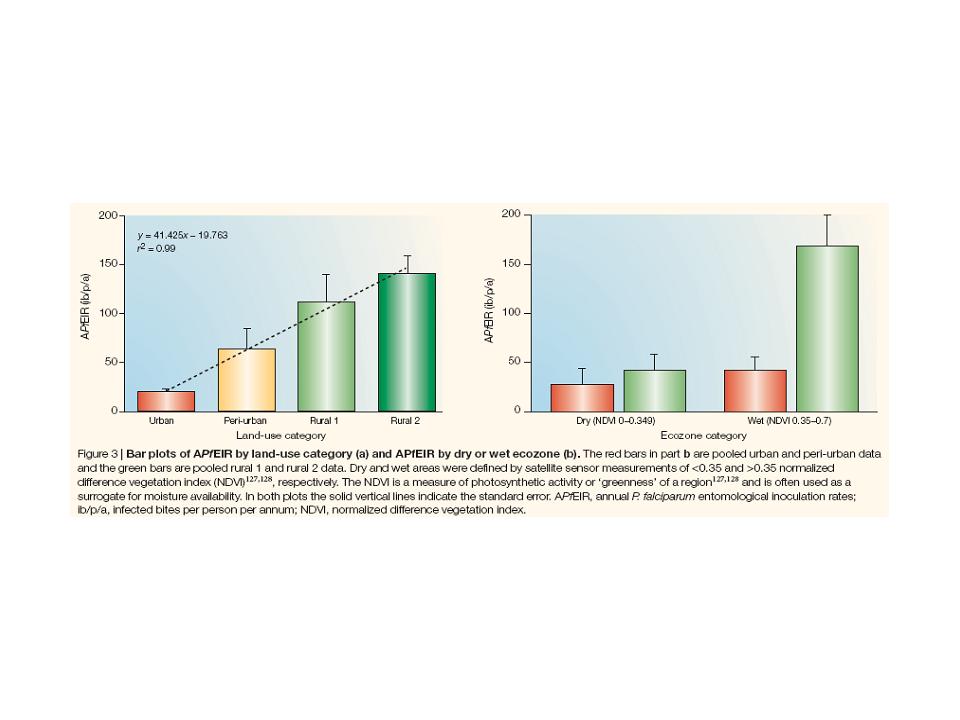
 | Hay et al. 2005a (fig. 3) | EIRa by land-use category | Africa | - | - | - | - | rural, urban |
|---|
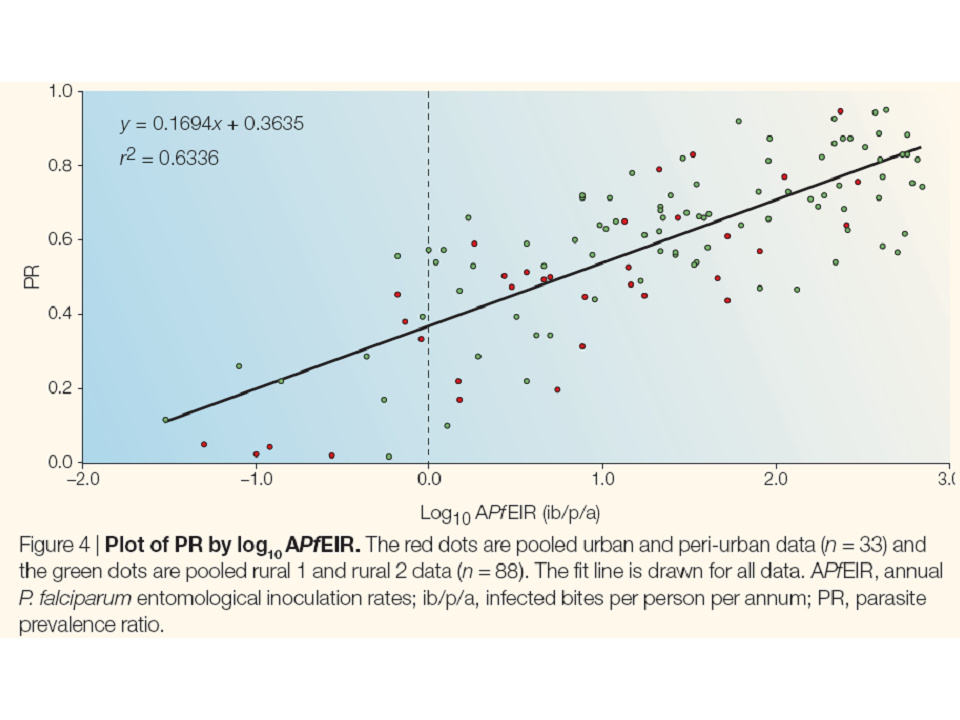
 | Hay et al. 2005a (fig. 4) | PRa by log(EIRa) | Africa | - | - | - | - | urban, peri-urban and rural data |
|---|
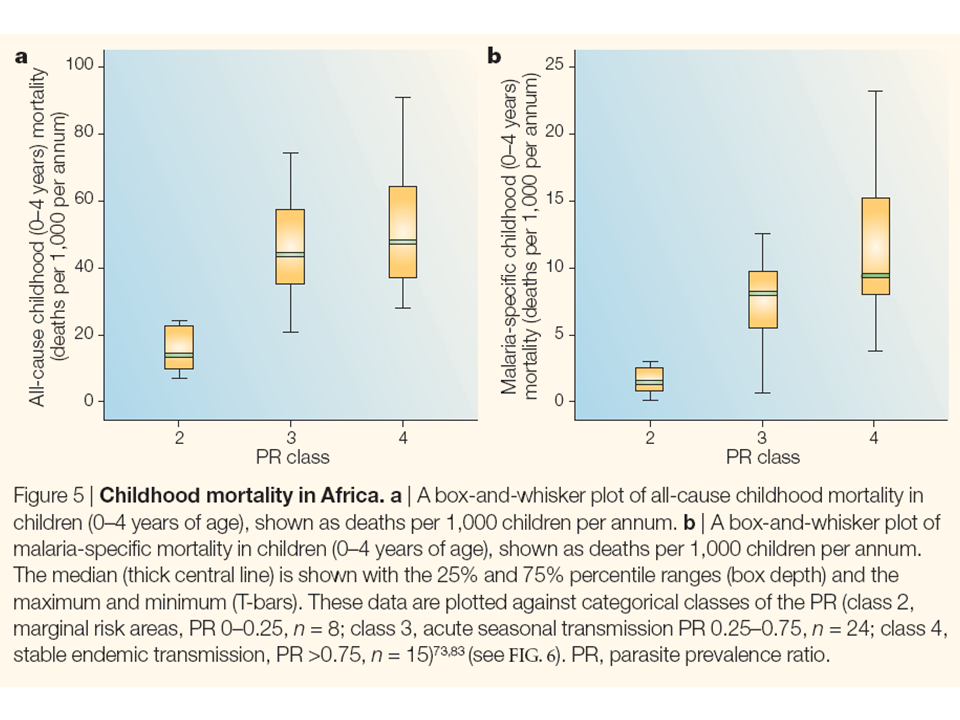
 | Hay et al. 2005a (fig. 5) | childhood mortality according to PR classes | Africa | - | - | - | - | urban, peri-urban and rural data |
|---|
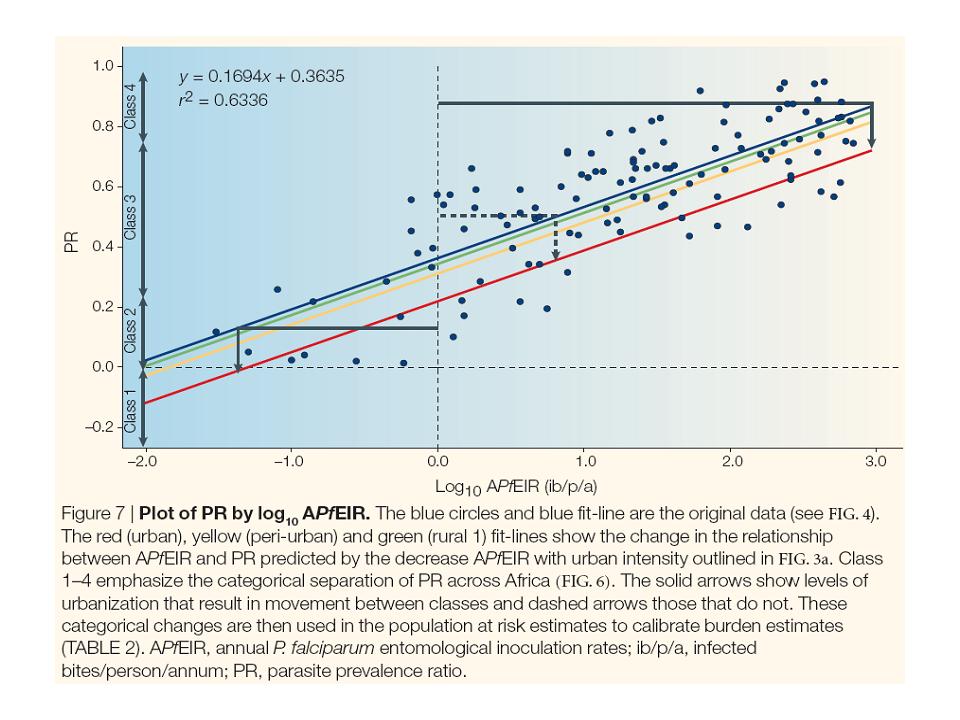
 | Hay et al. 2005a (fig. 7) | PRa by log(EIRa) | Africa | - | - | - | - | fit-lines for rural and urban |
|---|
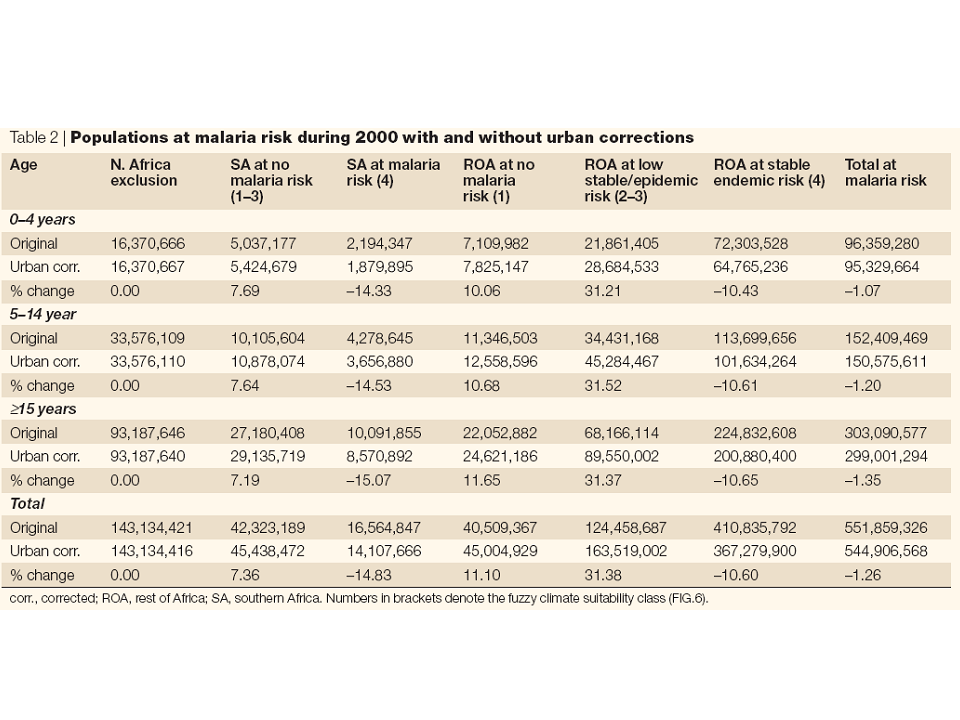
 | Hay et al. 2005a (tab. 2) | populations at malaria risk | Africa | - | - | 2000 | - | with and without urban corrections |
|---|
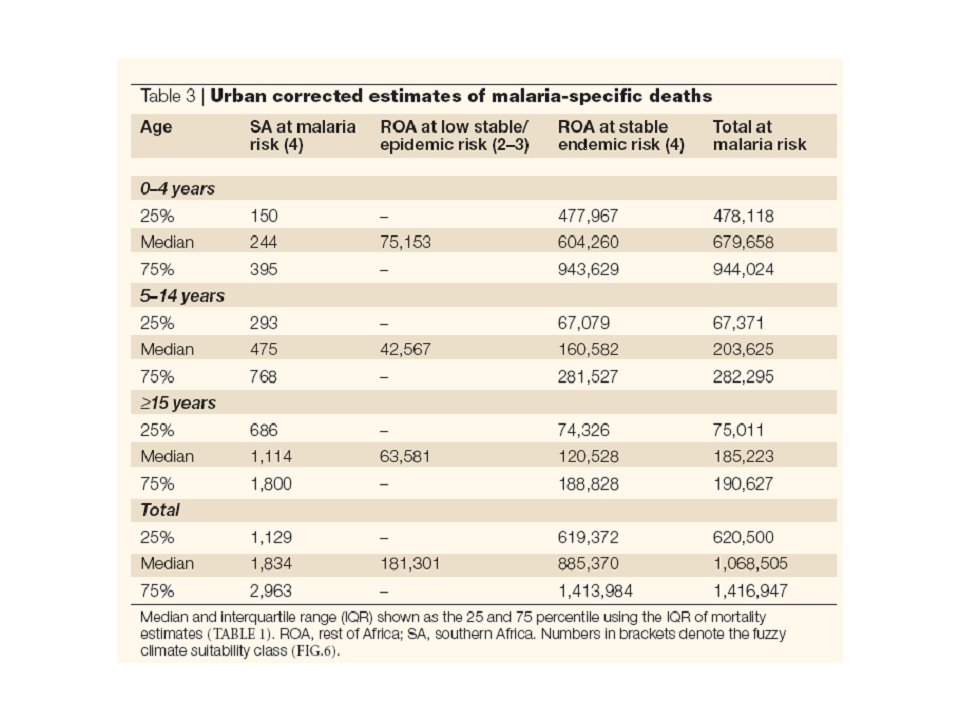
 | Hay et al. 2005a (tab. 3) | estimates of malaria deaths | Africa | - | - | 2000 | - | urban corrected |
|---|
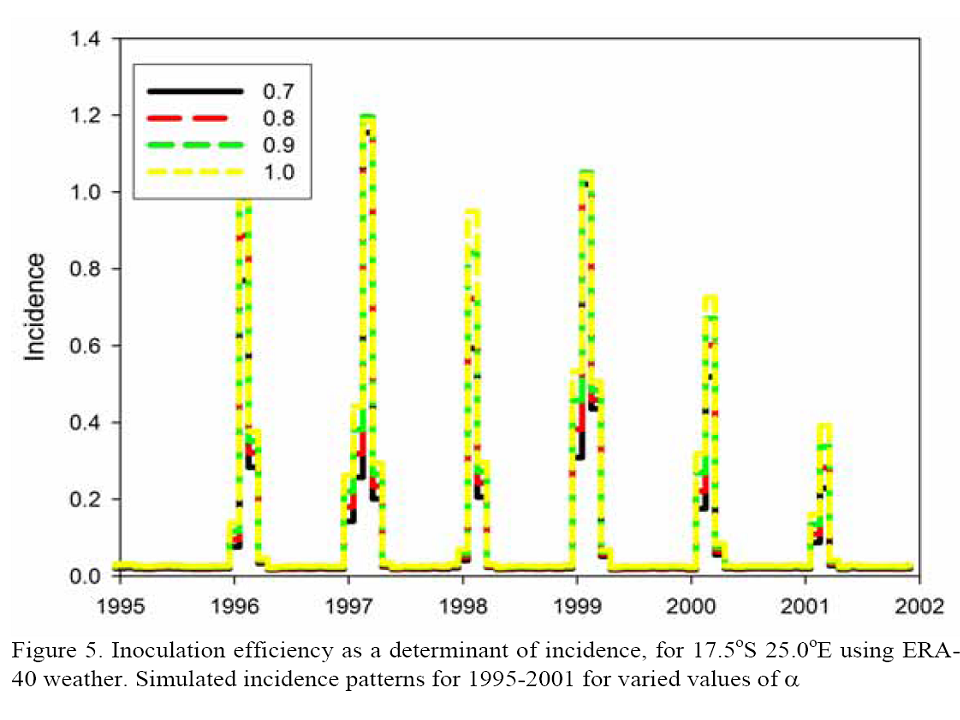
 | Hoshen and Morse 2005 (fig. 5) | INC?? | Botswana | ERA40 grid point | 17°30'S, 25°00'E | 199501-200112 | - | LMM sensitivity relative to different inoculation-efficiency parameters |
|---|
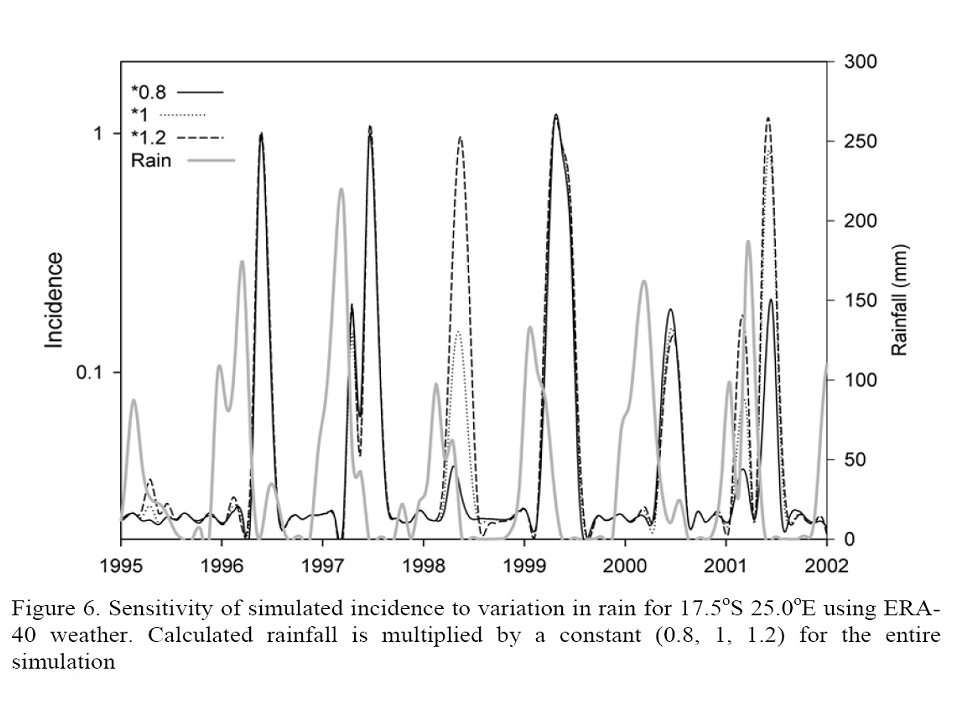
 | Hoshen and Morse 2005 (fig. 6) | INC?? | Botswana | ERA40 grid point | 17°30'S, 25°00'E | 199501-200112 | - | LMM sensitivity relative to different precipitation amounts |
|---|
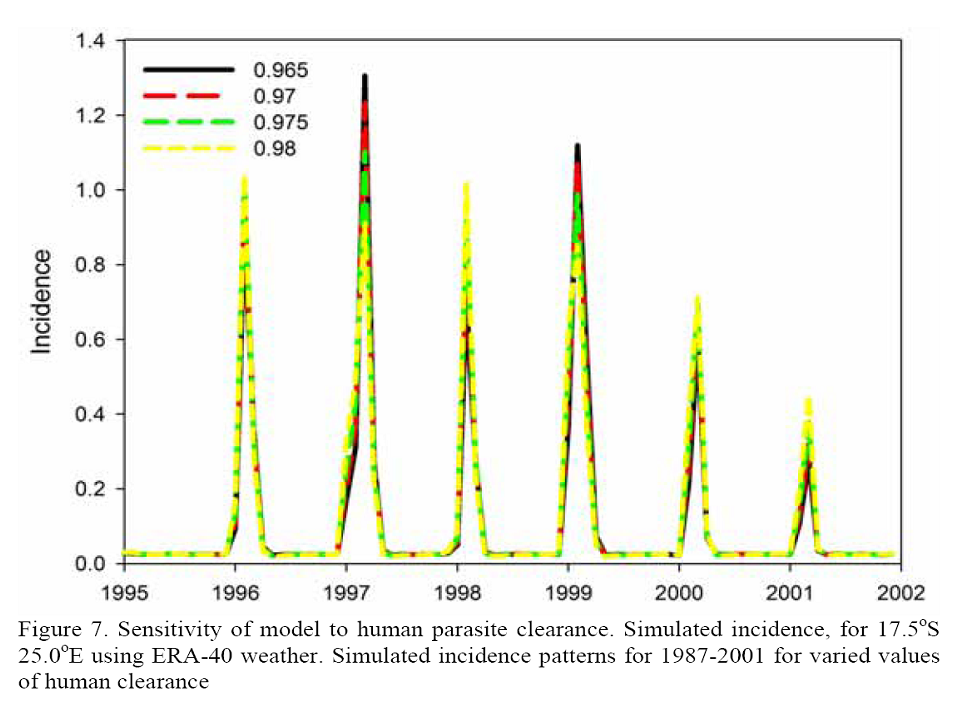
 | Hoshen and Morse 2005 (fig. 7) | INC?? | Botswana | ERA40 grid point | 17°30'S, 25°00'E | 199501-200112 | - | LMM sensitivity relative to different values of malaria parasite clearance |
|---|
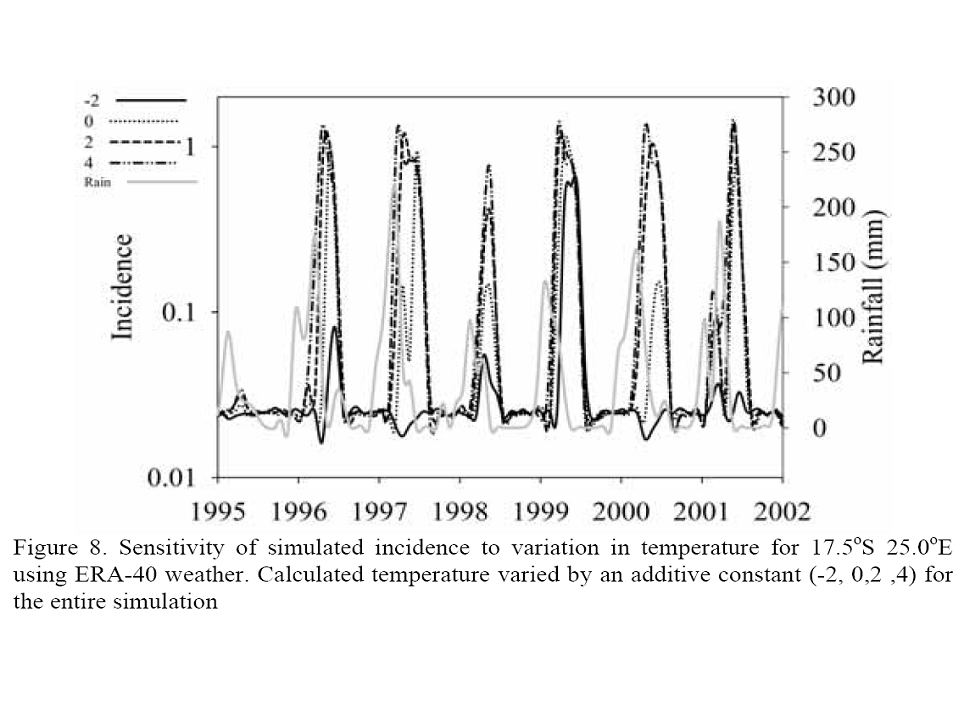
 | Hoshen and Morse 2005 (fig. 8) | INC?? | Botswana | ERA40 grid point | 17°30'S, 25°00'E | 199501-200112 | - | LMM sensitivity relative to different temperatures |
|---|
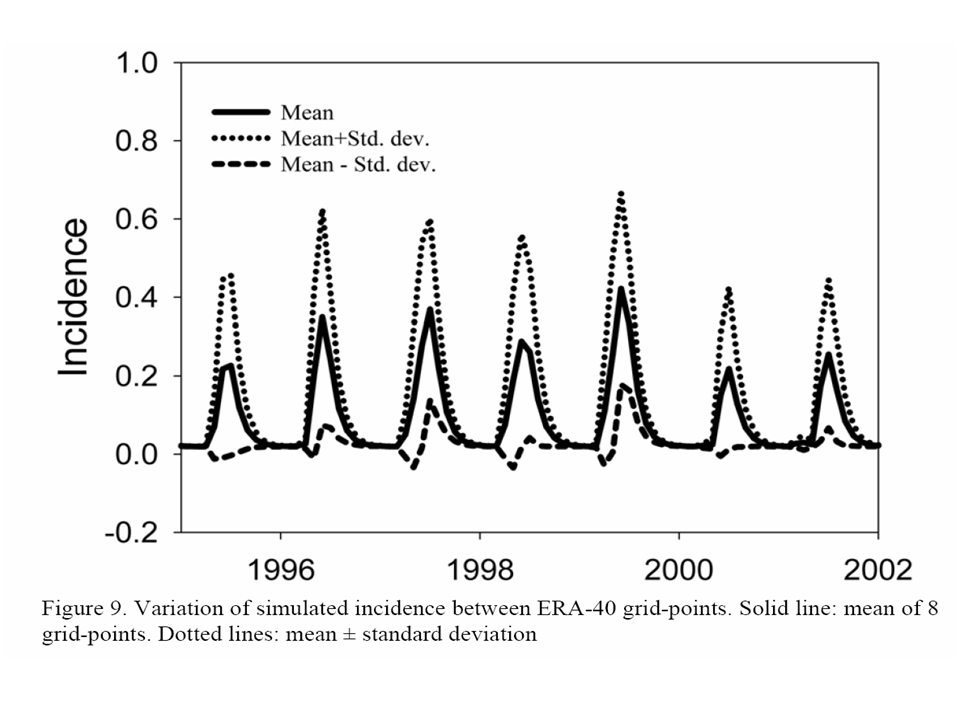
 | Hoshen and Morse 2005 (fig. 9) | INC?? | Botswana | 8 ERA40 grid points | latitudes: 17°30'S and 22°30'S, longitudes: 20°00'E, 22°30'E, 25°00'E, 27°30'E and 30°00'E | 199501-200112 | - | LMM sensitivity relative to different temperatures |
|---|
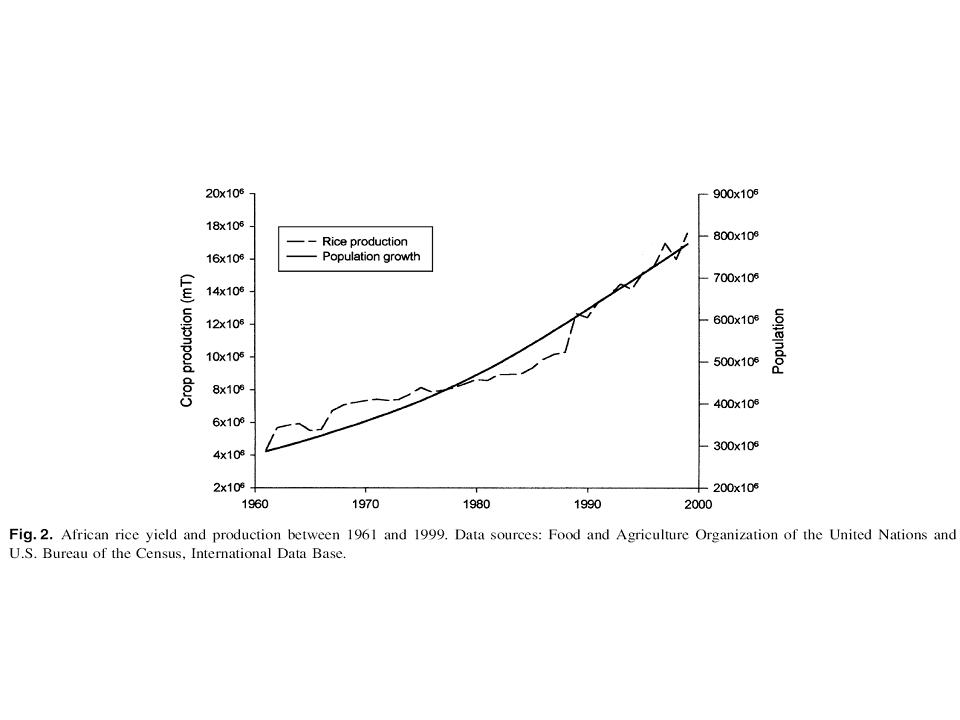
 | Ijumba and Lindsay 2001 (fig. 2) | African rice production, population | Africa | - | - | 196101-199012 | - | - |
|---|
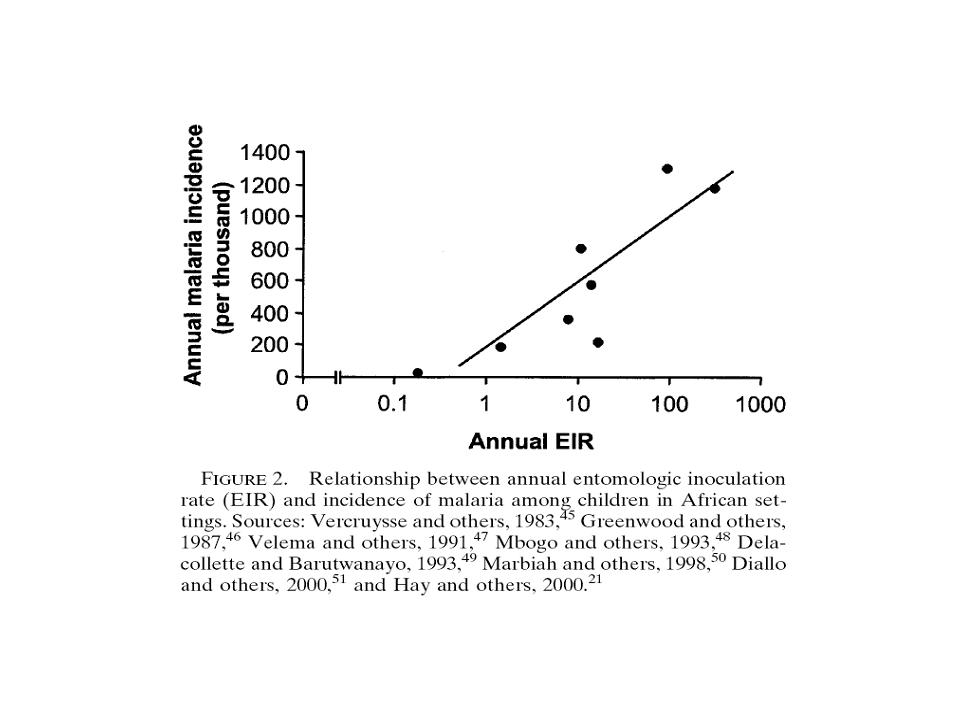
 | Keiser et al. 2004 (fig. 2) | INCa by EIRa | Africa | urban settings | - | - | - | children |
|---|
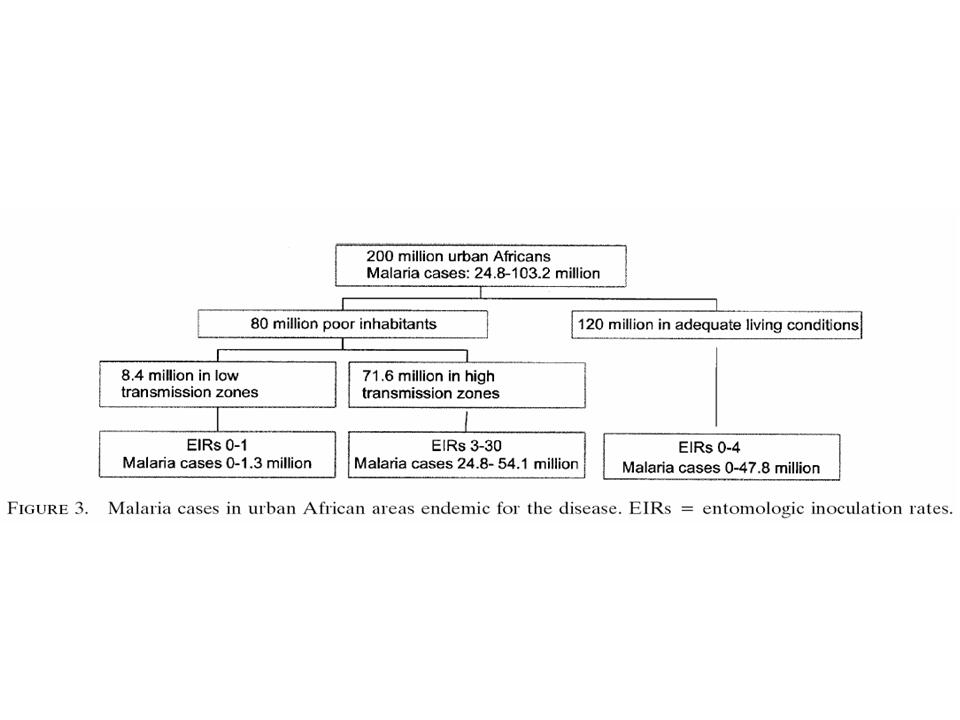
 | Keiser et al. 2004 (fig. 3) | CMCa, EIRa | Africa | urban settings | - | - | - | flow chart |
|---|
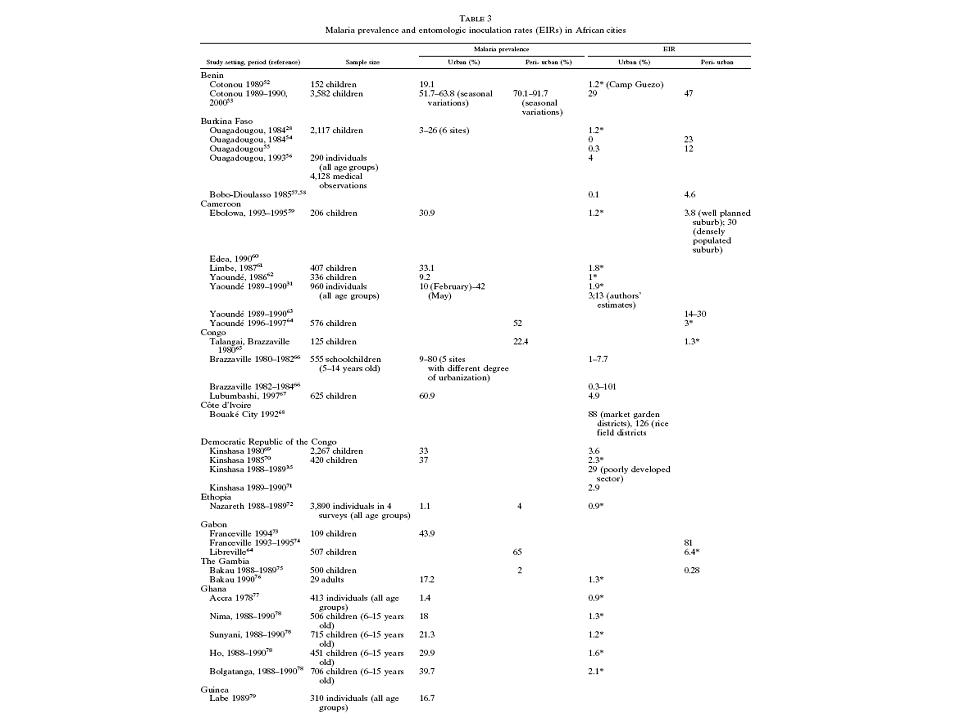
 | Keiser et al. 2004 (tab. 3a) | PRa, EIRa | Africa | urban settings | - | - | - | broken down into countries; sources |
|---|
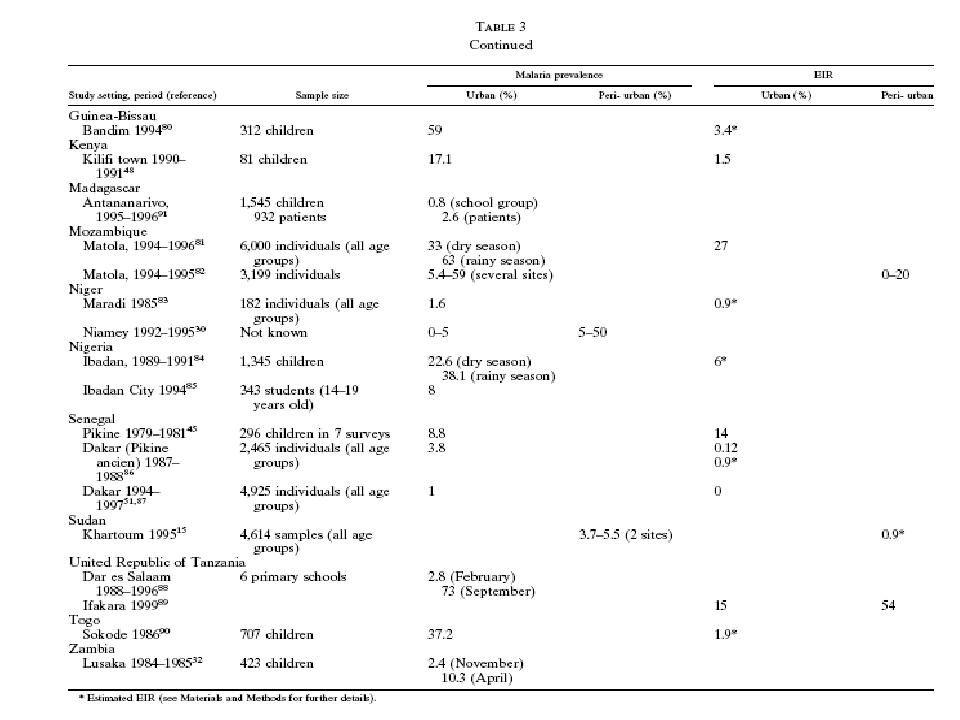
 | Keiser et al. 2004 (tab. 3b) | PRa, EIRa | Africa | urban settings | - | - | - | broken down into countries; sources |
|---|
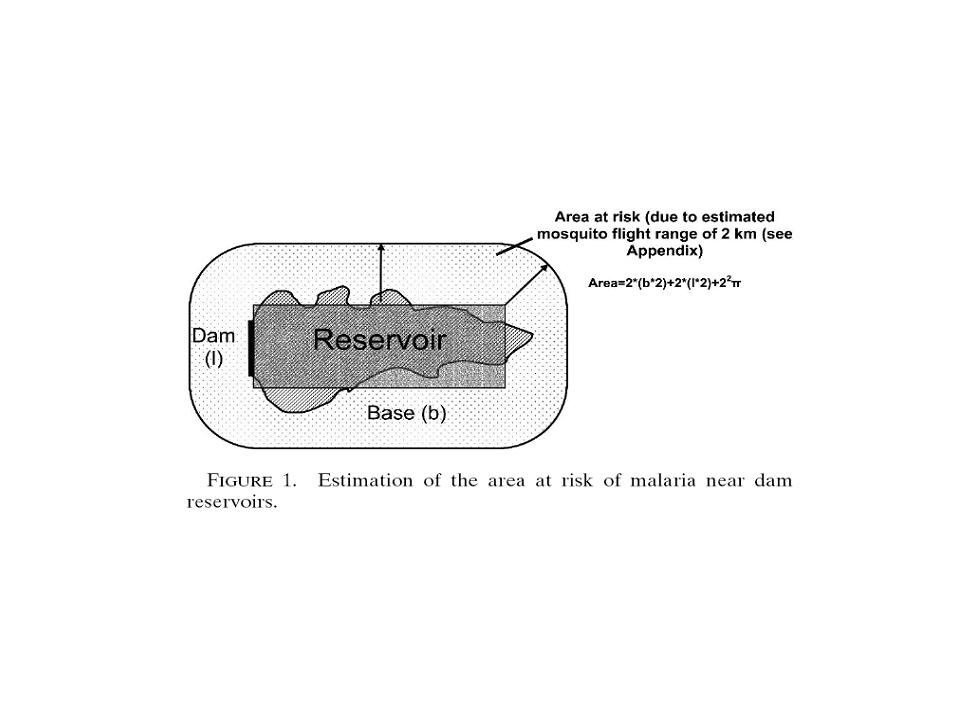
 | Keiser et al. 2005 (fig. 1) | malaria risk near dam reservoirs | - | - | - | - | - | sketch |
|---|
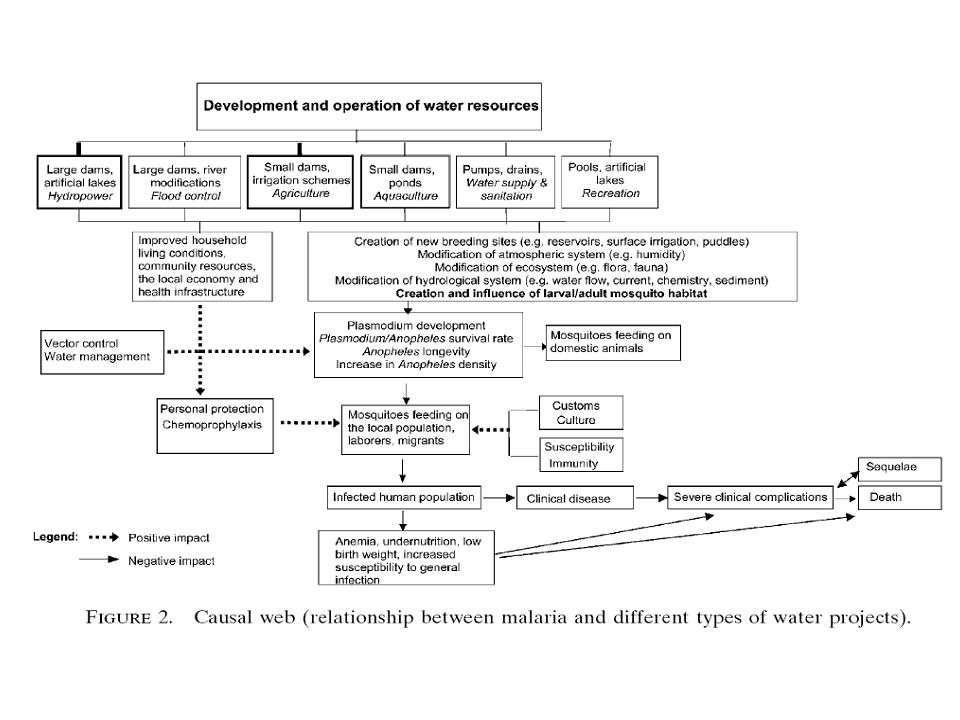
 | Keiser et al. 2005 (fig. 2) | relationship between malaria and water projects | - | - | - | - | - | flow chart |
|---|
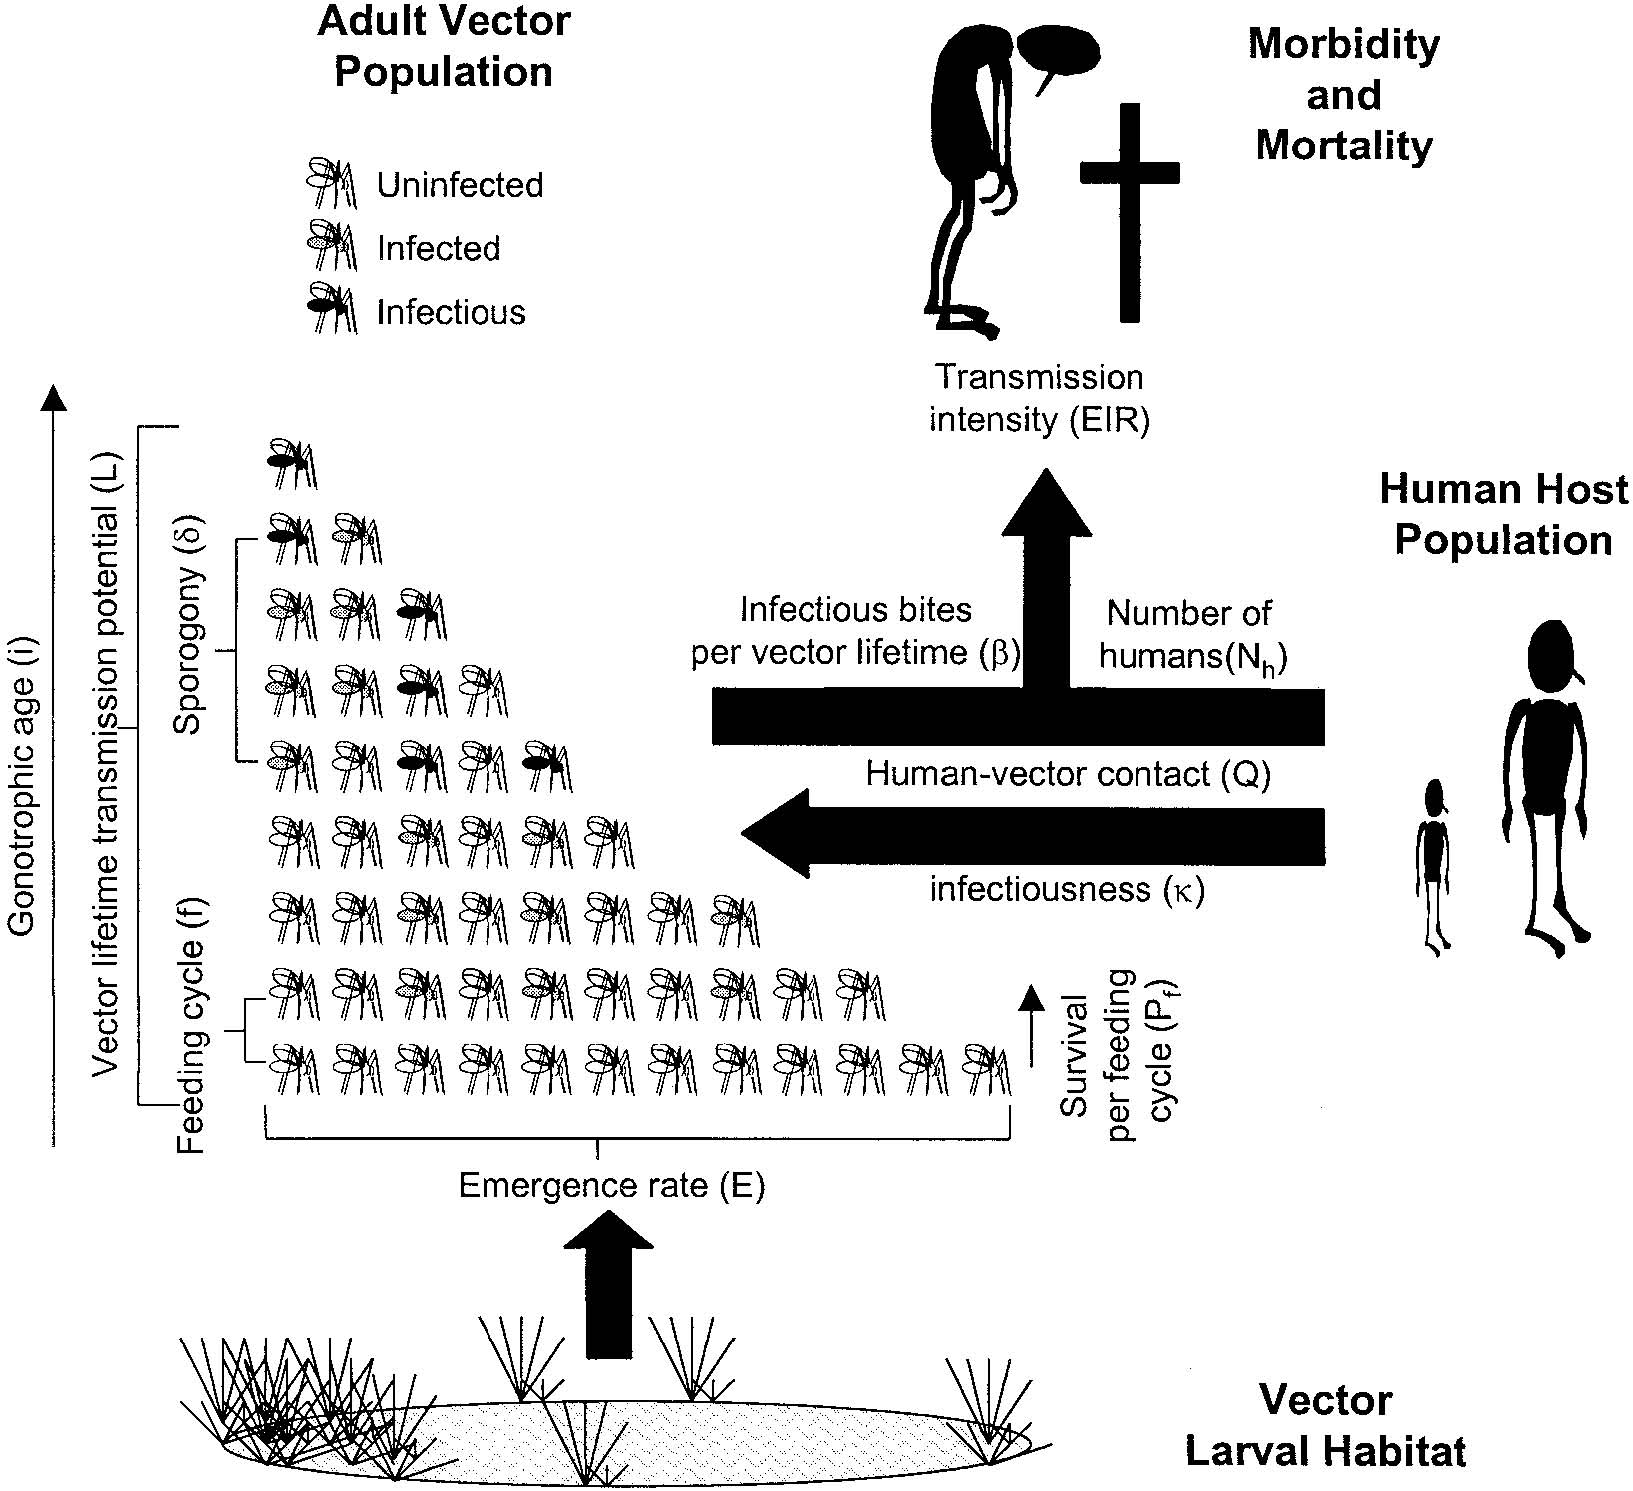
 | Killeen et al. 2000 (fig. 1) | nature of malaria | - | - | - | - | - | outline of the model |
|---|
 | Le Houérou 1996 (fig. 4) | population | northern Africa, Near East | - | - | 190001-199012 | - | - |
|---|
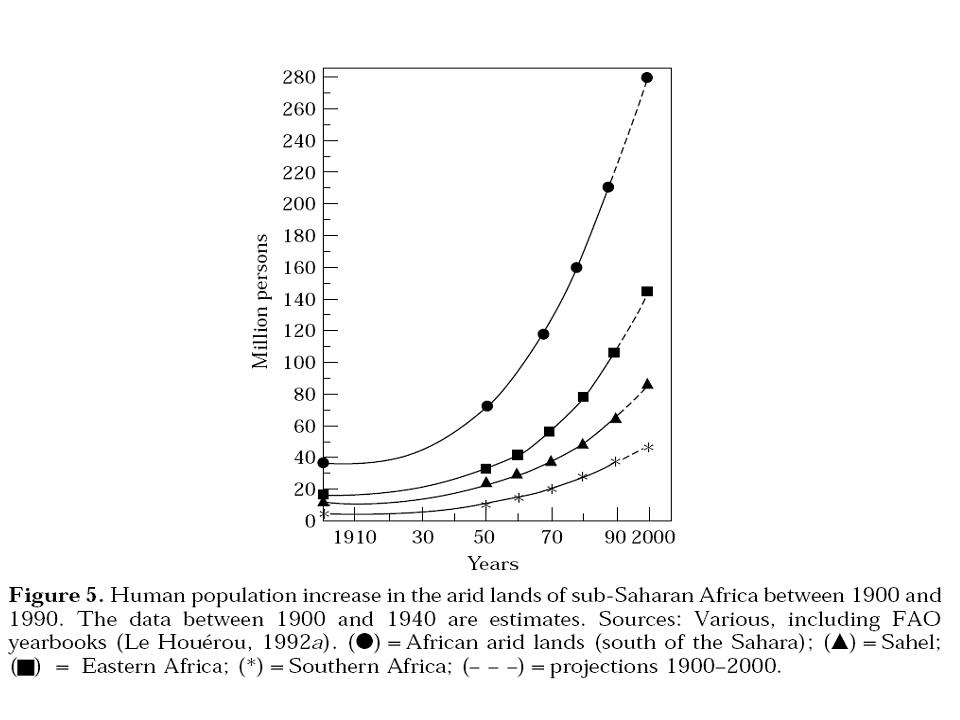
 | Le Houérou 1996 (fig. 5) | population | sub-Saharan Africa | arid lands of the Sahel, eastern Africa, southern Africa | - | 190001-199012 | - | - |
|---|
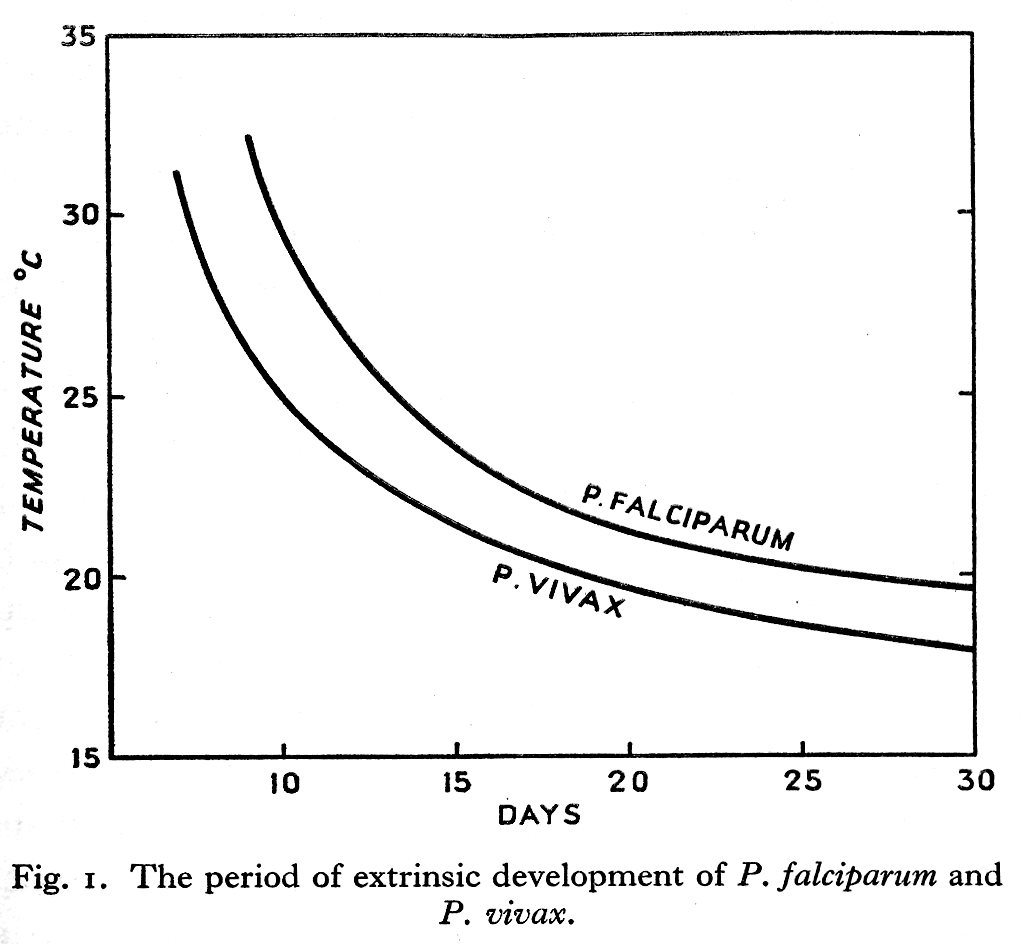
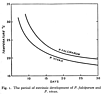 | Macdonald 1957 (fig. 1) | duration of sporogony | - | - | - | - | - | - |
|---|
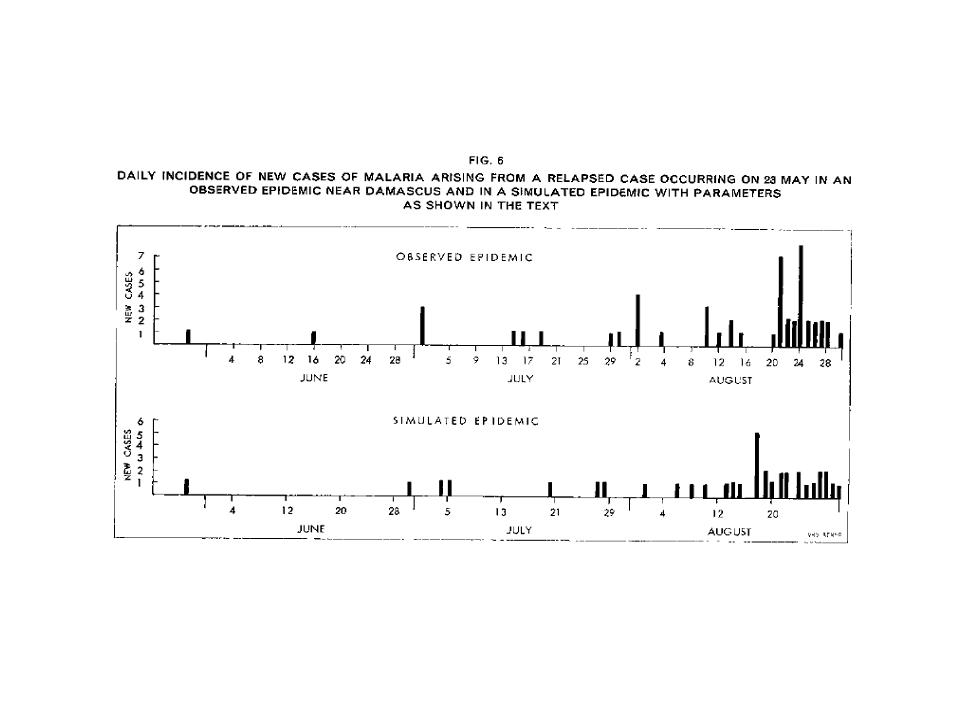
 | Macdonald et al. 1968 (fig. 6) | observed and simulated INCd | Syria | Damascus | - | 196505-196508 | - | - |
|---|
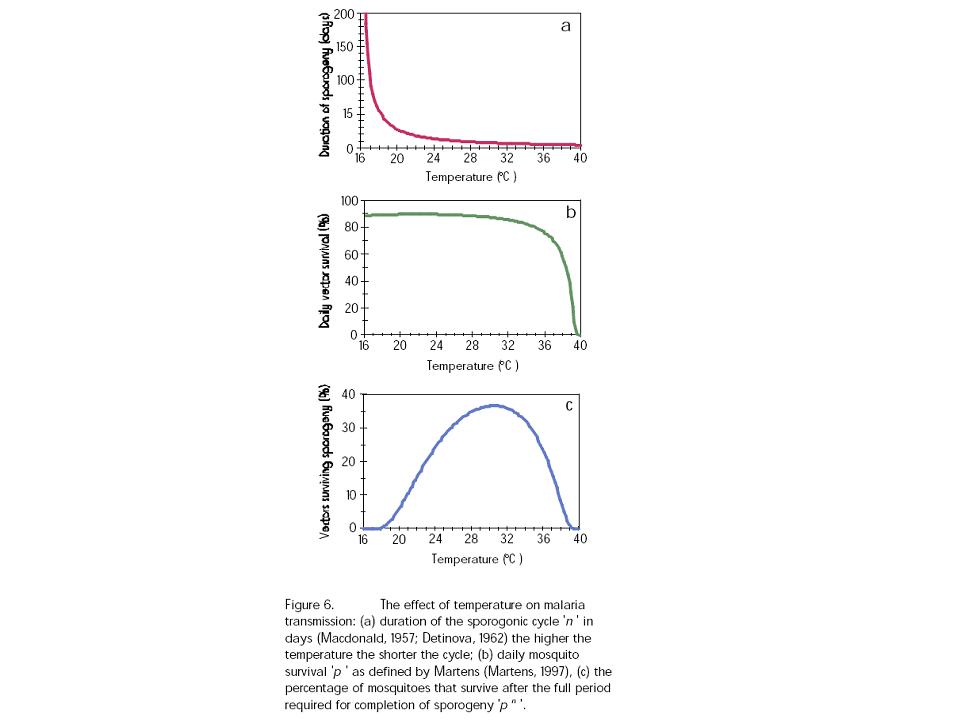
 | MARA/ARMA 1998 (fig. 6) | duration of the sporogonic cycle, pd, vectors surviving sporogony | Africa | - | - | - | - | - |
|---|
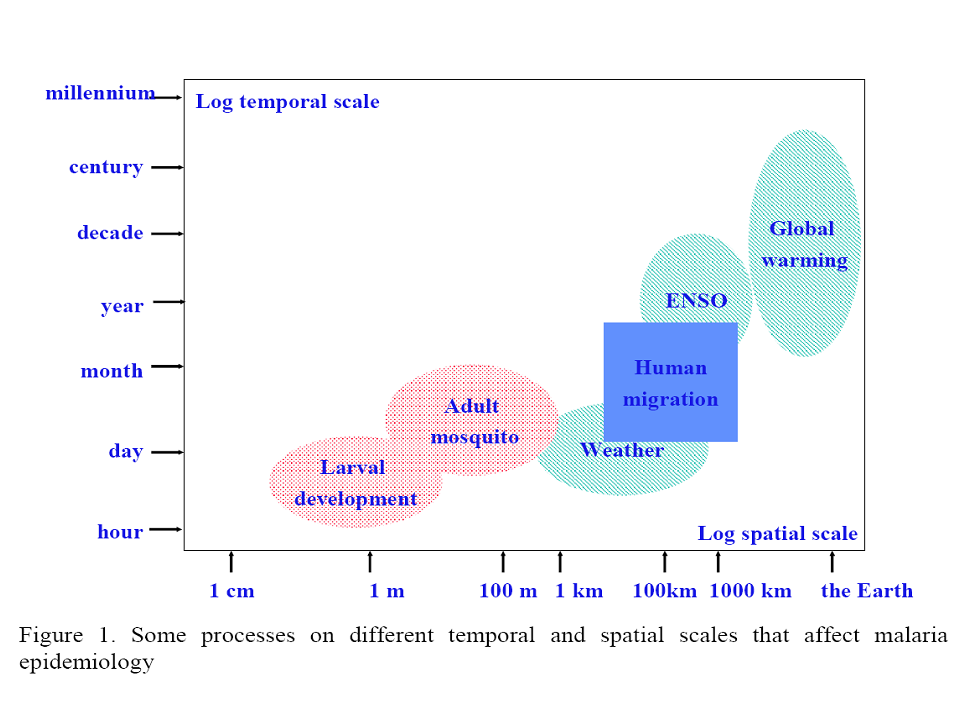
 | Martens and Thomas 2005 (fig. 1) | temporal and spatial malaria scales | - | - | - | - | - | - |
|---|
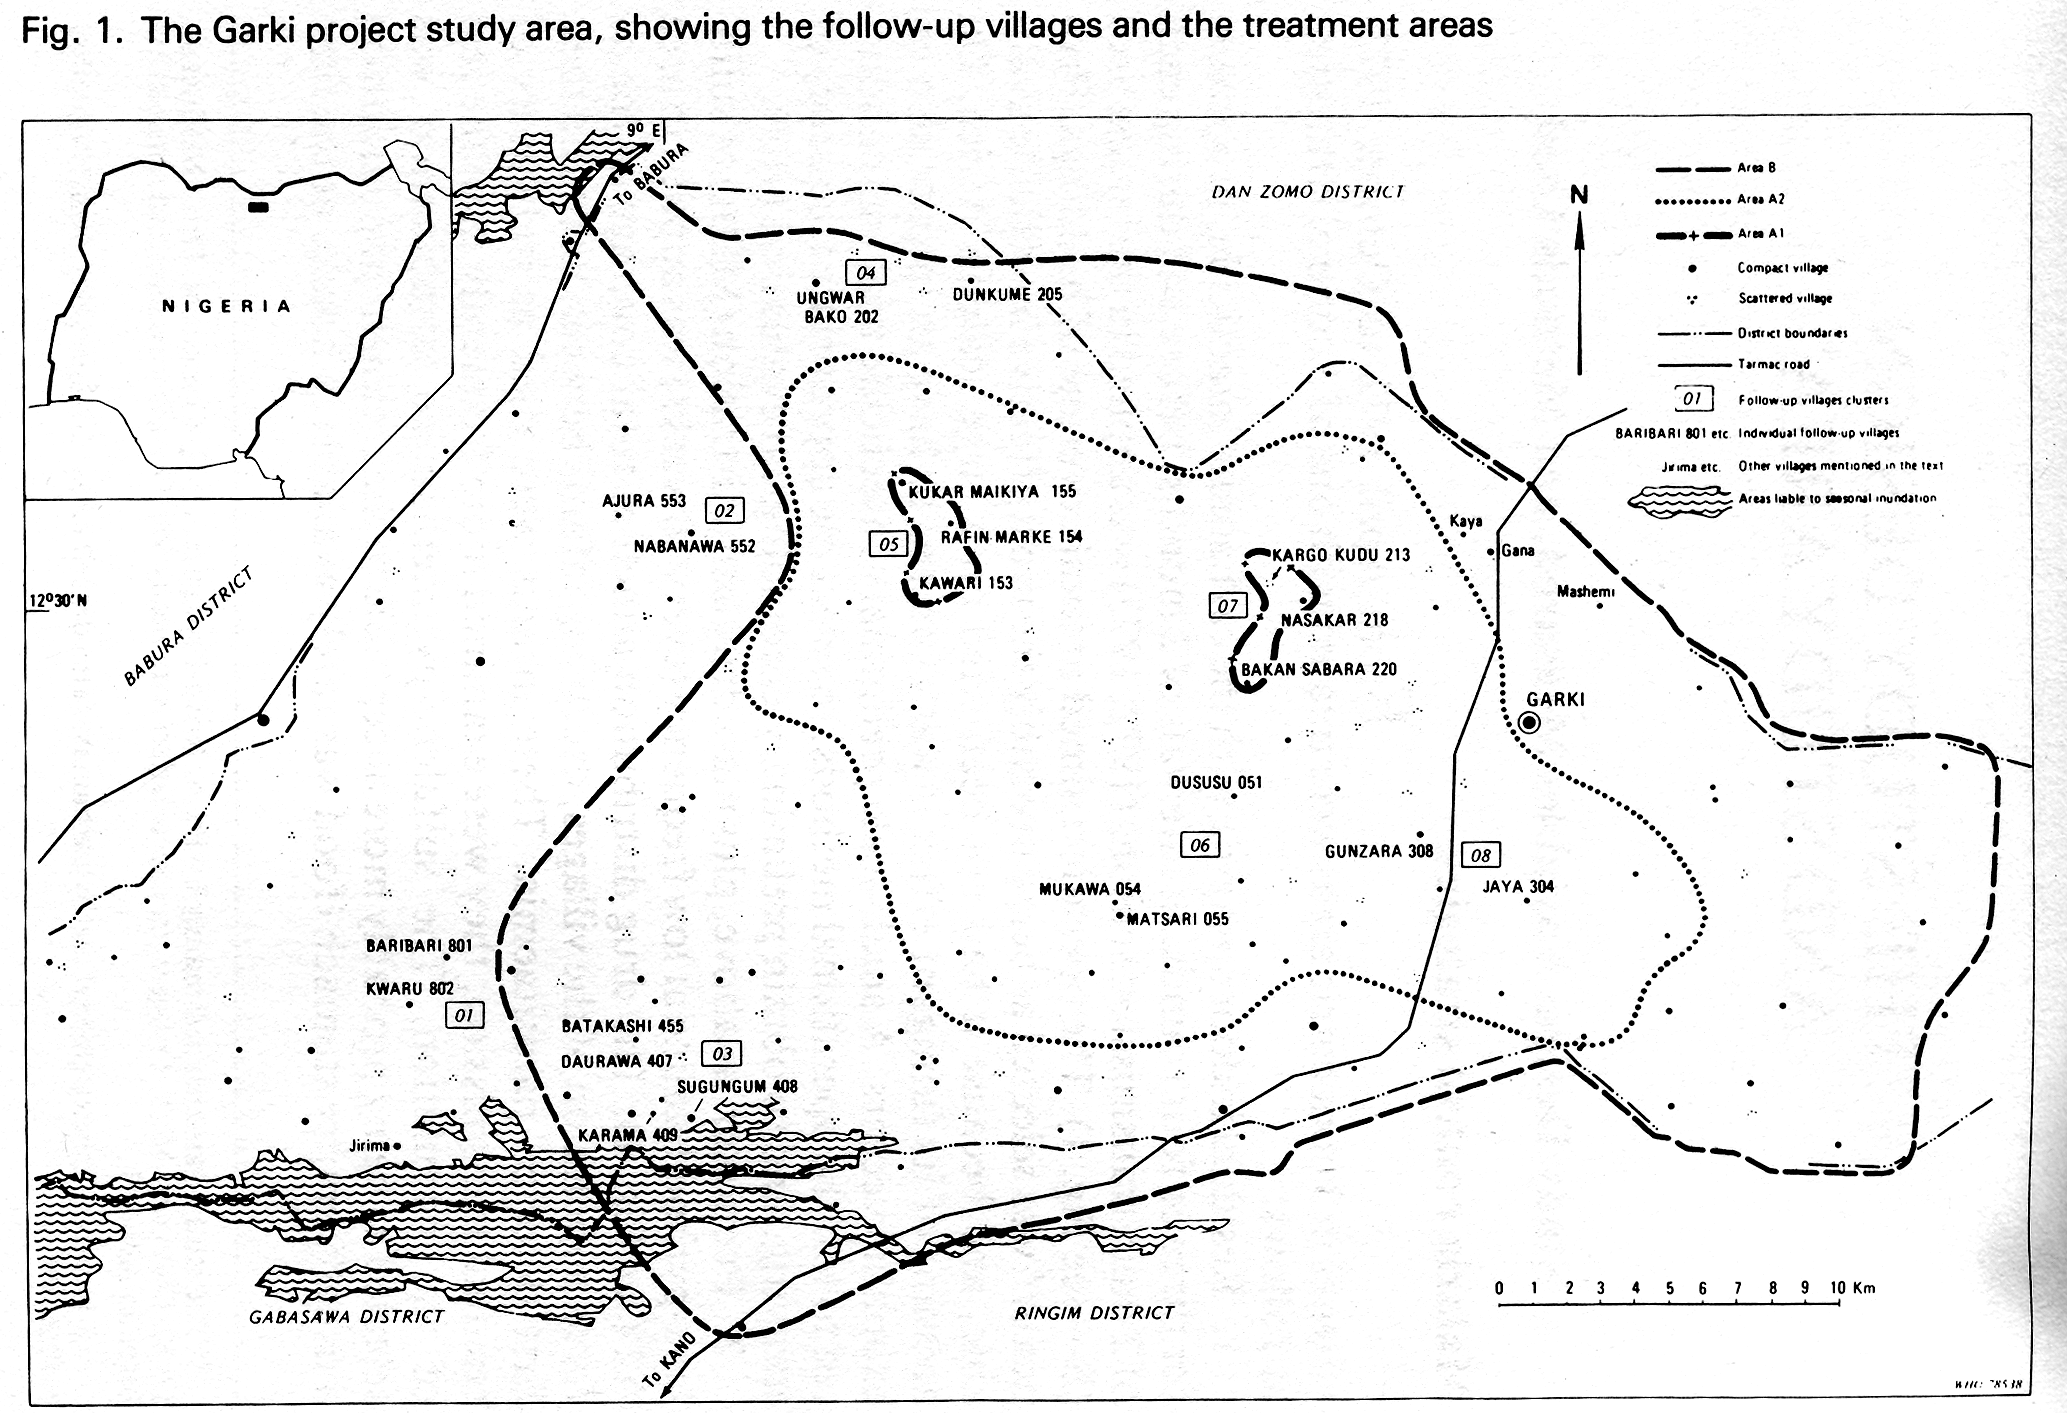
 | Molineaux and Gramiccia 1980 (fig. 1) | study area | Nigeria | Garki district | 12°26'N, 9°11'E† | - | - | - |
|---|
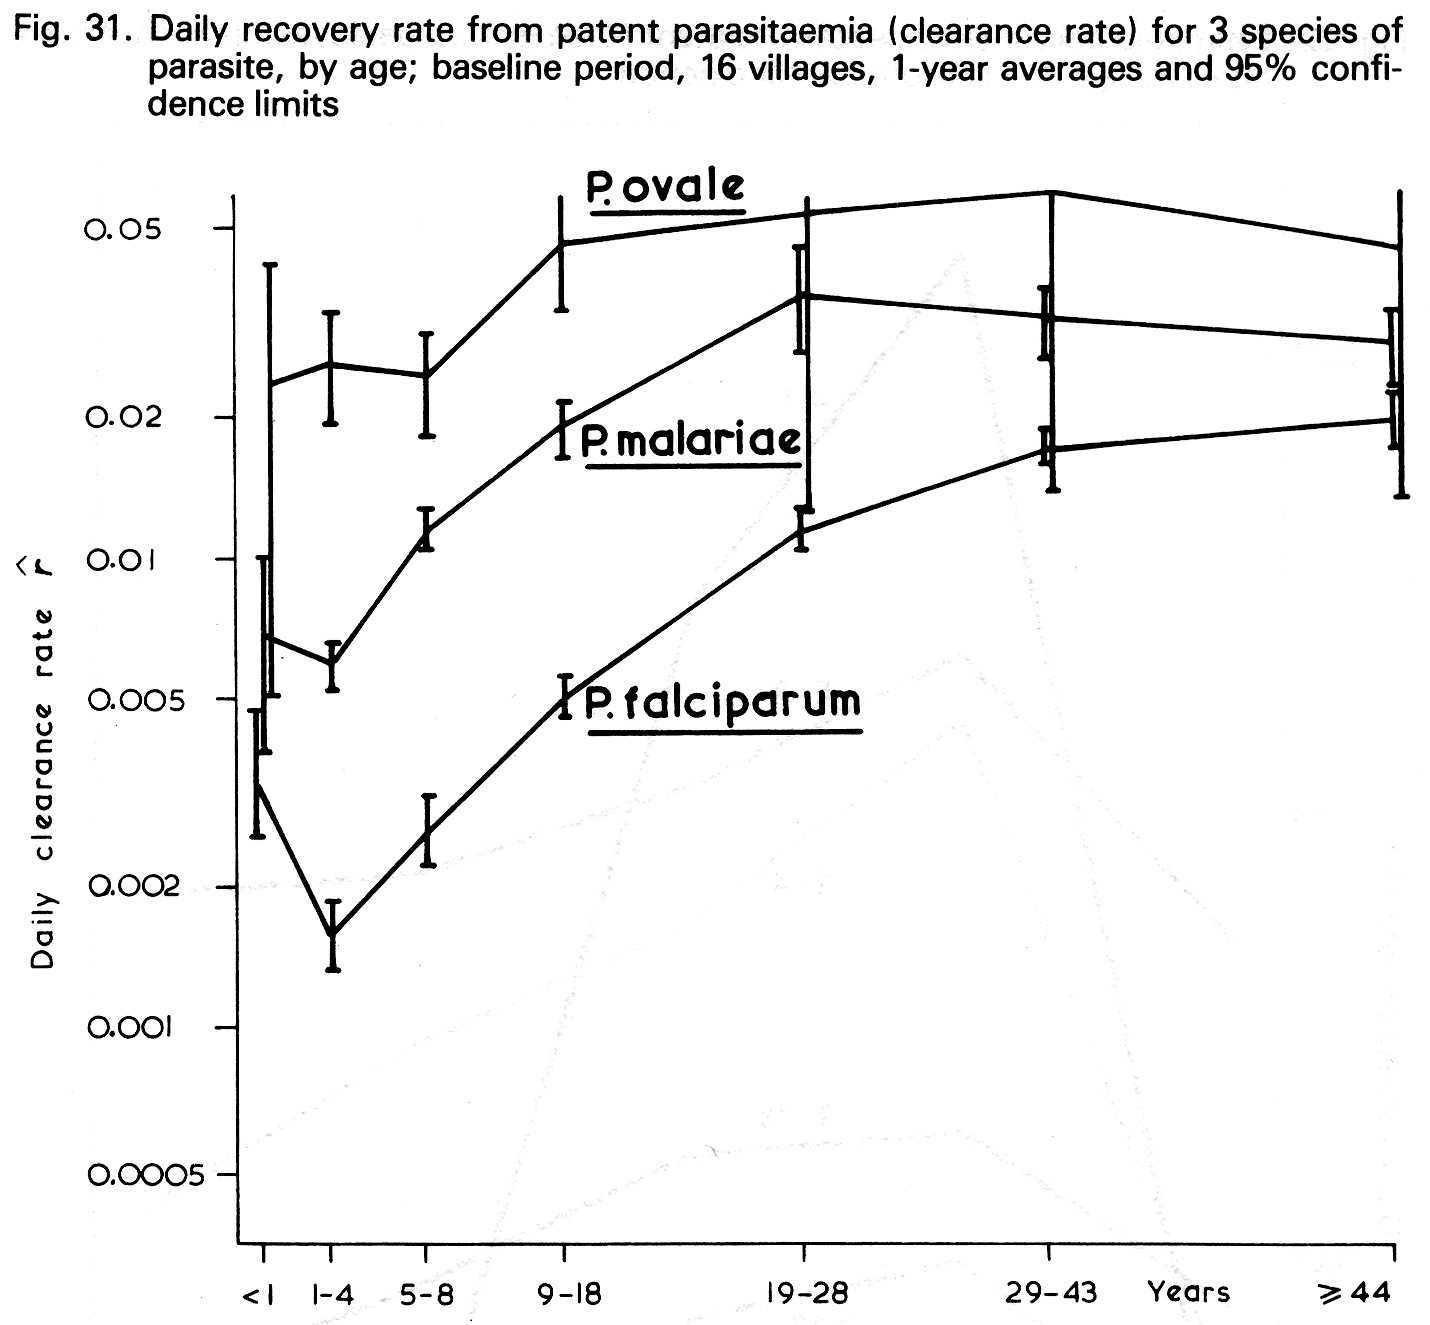
 | Molineaux and Gramiccia 1980 (fig. 31) | age classes regarding the daily recovery rate | Nigeria | Garky district | 12°26'N, 9°11'E† | 197001-197212 | - | - |
|---|
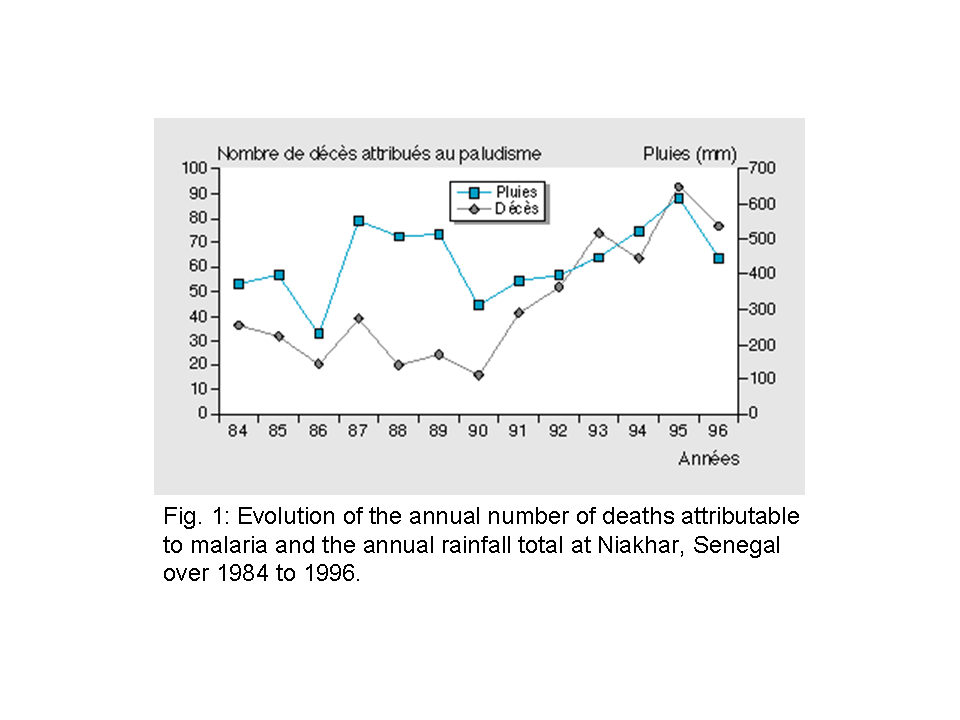
 | Ndiaye et al. 2001 (fig. 1) | RRa, annual amount of malaria deaths | Senegal | Niakhar | 14°28'N, -16°24'E | 1984 to 1996 | - | - |
|---|
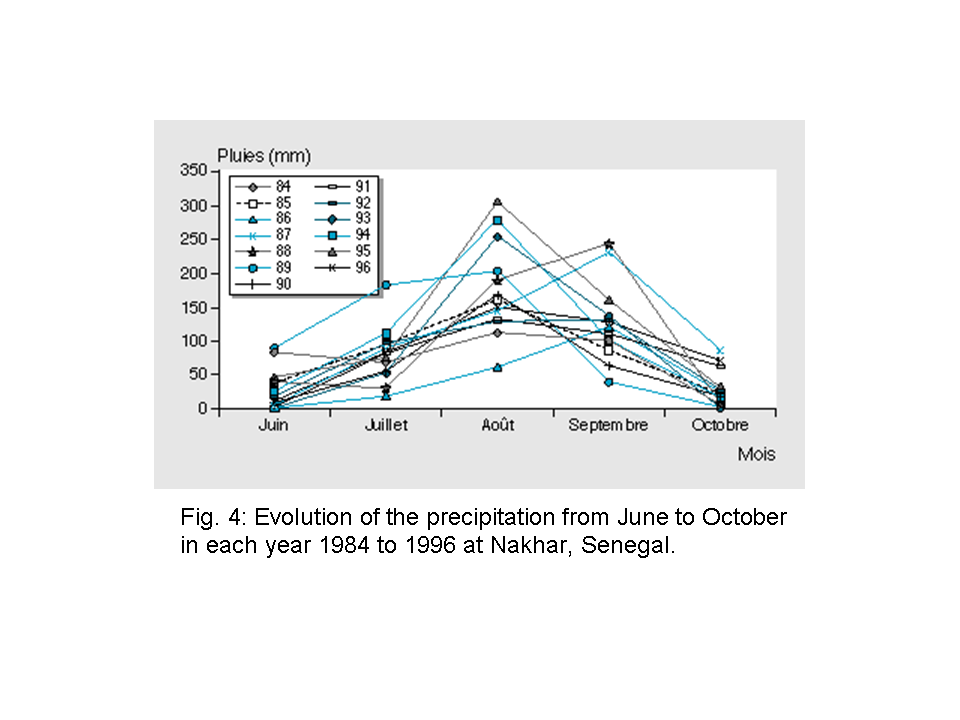
 | Ndiaye et al. 2001 (fig. 4) | RRm | Senegal | Niakhar | 14°28'N, -16°24'E | 1984 to 1996 | - | - |
|---|
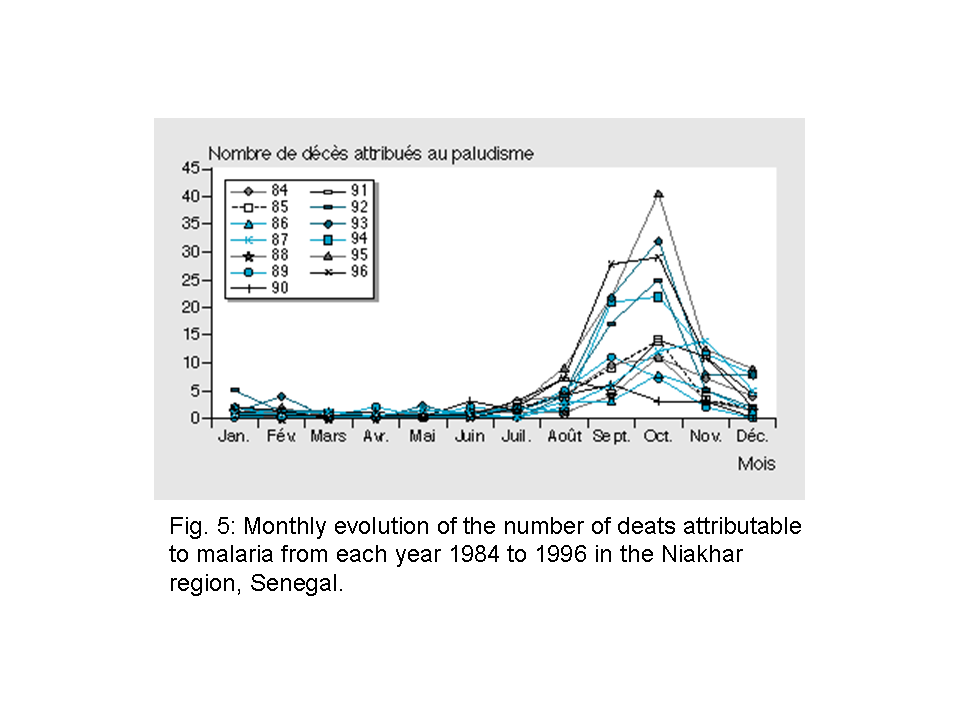
 | Ndiaye et al. 2001 (fig. 5) | monthly malaria deaths | Senegal | Niakhar | 14°28'N, -16°24'E | 1984 to 1996 | - | - |
|---|
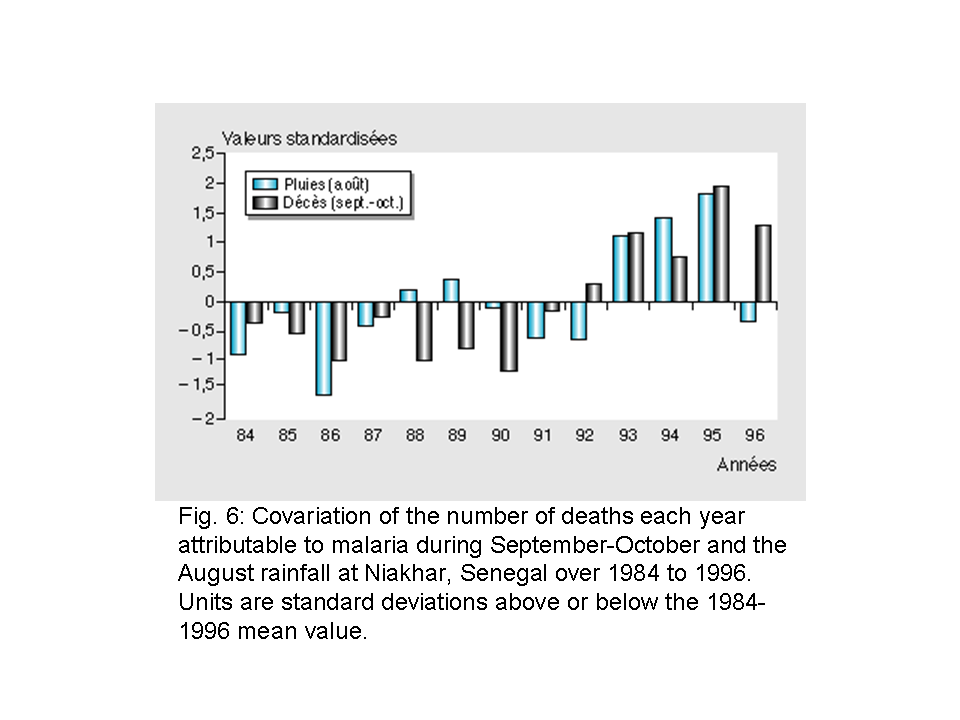
 | Ndiaye et al. 2001 (fig. 6) | covariation of the number of malaria deaths during September to October and the August rainfall | Senegal | Niakhar | 14°28'N, -16°24'E | 1984 to 1996 | - | - |
|---|
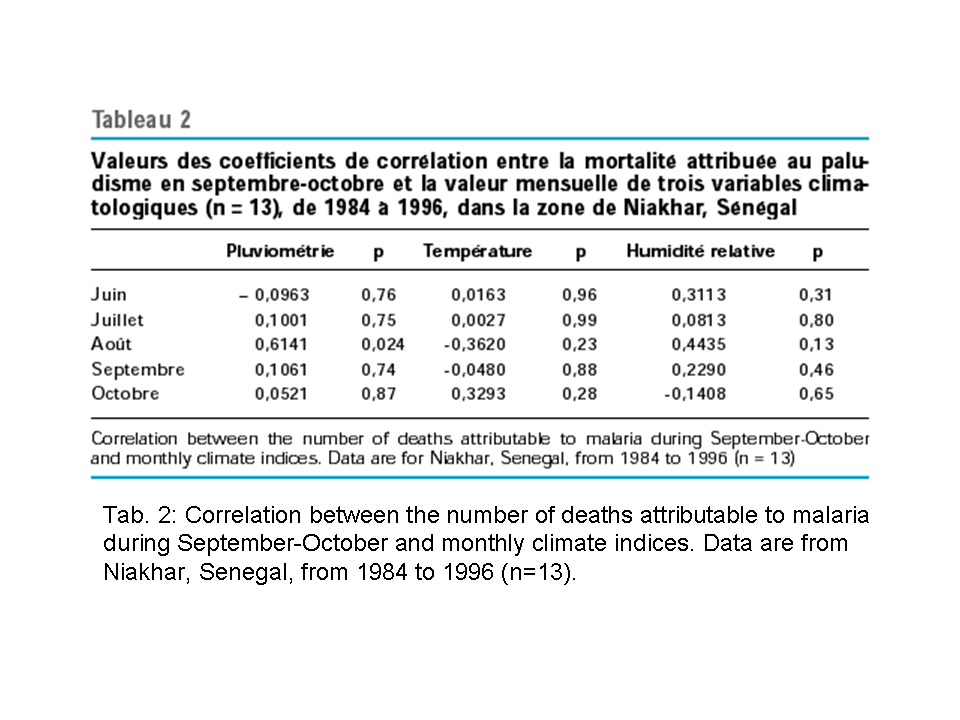
 | Ndiaye et al. 2001 (tab. 2) | correlation between the number of malaria deaths during September to October and monthly climate indices | Senegal | Niakhar | 14°28'N, -16°24'E | 1984 to 1996 | - | - |
|---|
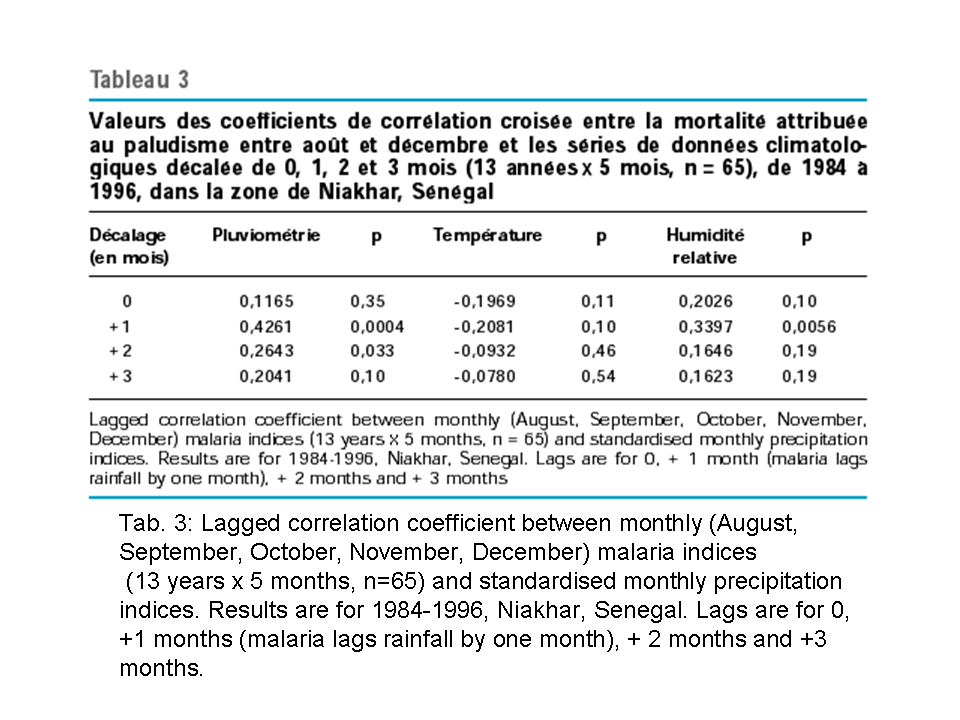
 | Ndiaye et al. 2001 (tab. 3) | lagged correlation coefficients between monthly malaria and precipitation indices | Senegal | Niakhar | 14°28'N, -16°24'E | 1984 to 1996 | - | - |
|---|
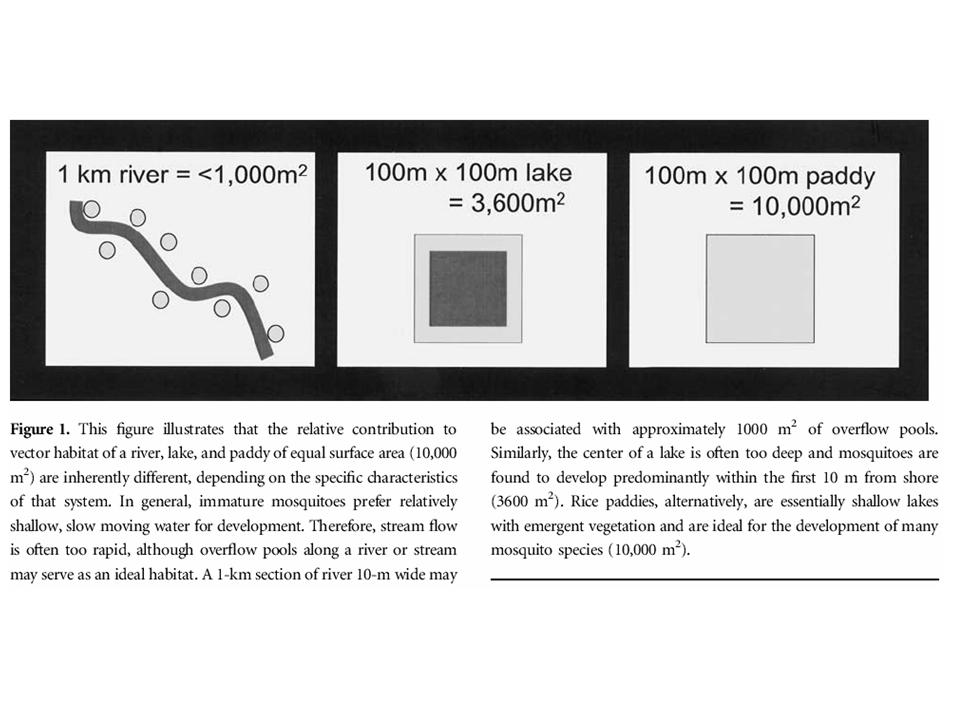
 | Norris 2004 (fig. 1) | river, lake and paddy as vector habitat | - | - | - | - | - | sketch |
|---|
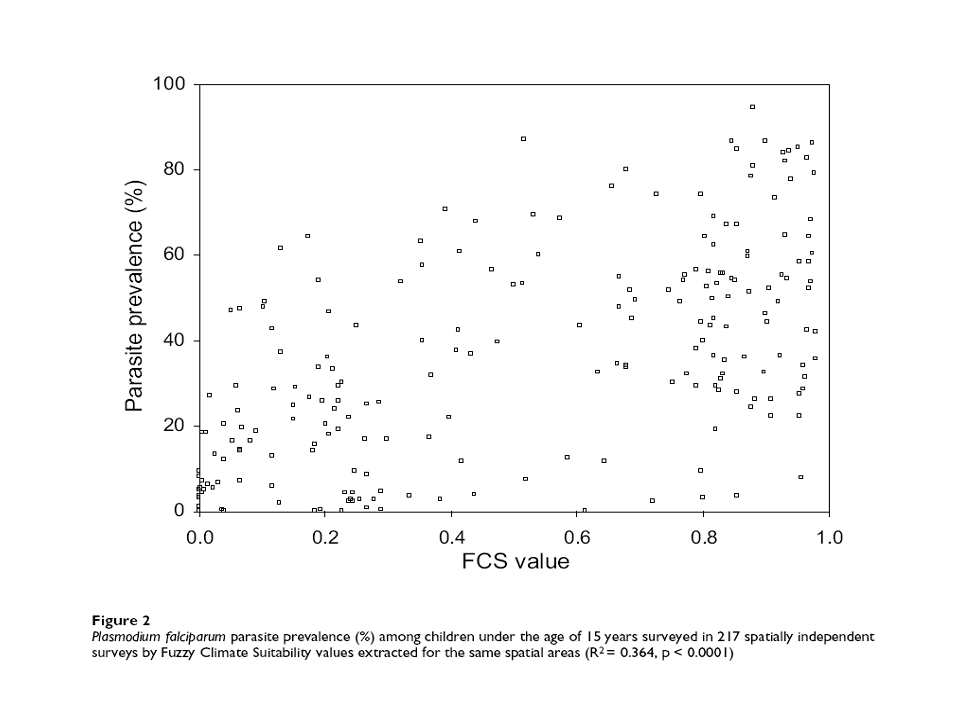
 | Omumbo et al. 2004 (fig. 2) | PR by fuzzy climate suitabilty | Kenya | - | - | - | - | among children under the age of 15 years |
|---|
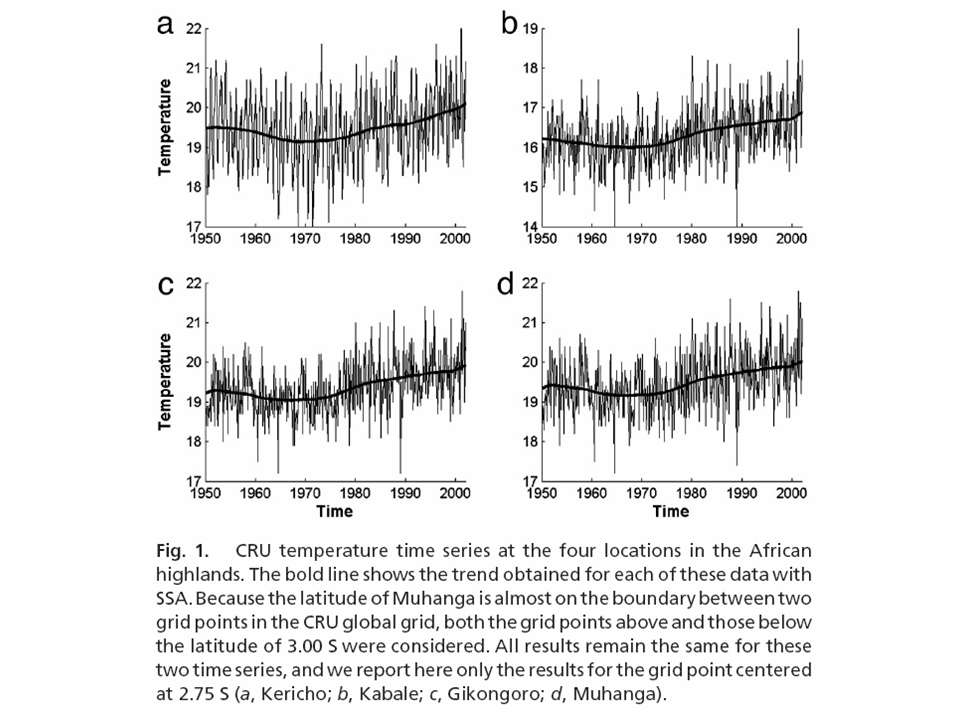
 | Pascual et al. 2006 (fig. 1) | Tm | Kenya | Kericho, Kabale, Gikongoro, Muhanga | - | 195001-200012 | - | CRU data?? for highland in Kenya |
|---|
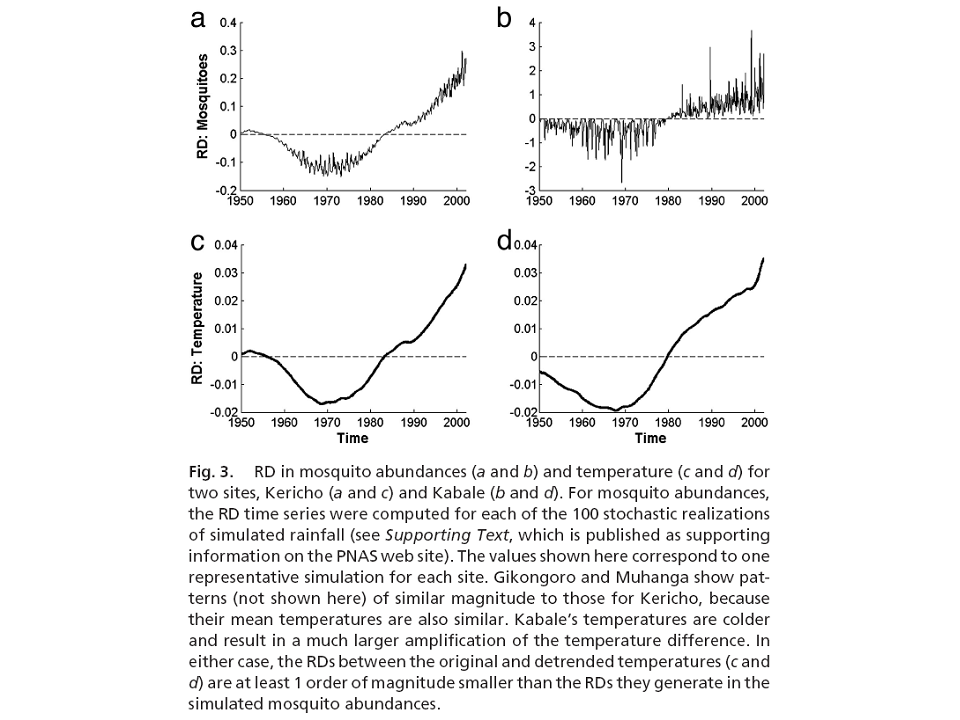
 | Pascual et al. 2006 (fig. 3) | relative difference in simulated MOSQm and Tm | Kenya | Kericho, Kabale, Gikongoro, Muhanga | - | 195001-200012 | - | CRU data?? for highland in Kenya |
|---|
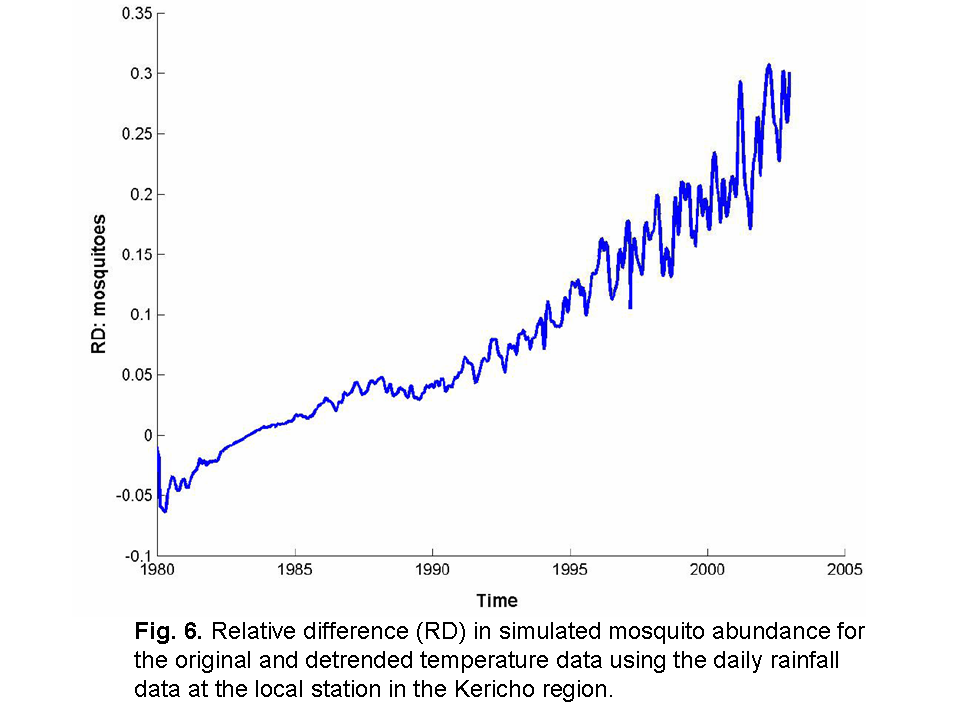
 | Pascual et al. 2006 (fig. 6) | relative difference in simulated MOSQm for the original and detrended temperature data | Kenya | Kericho | - | - | - | the simulation is using the daily rainfall data at the local station in the Kericho region |
|---|
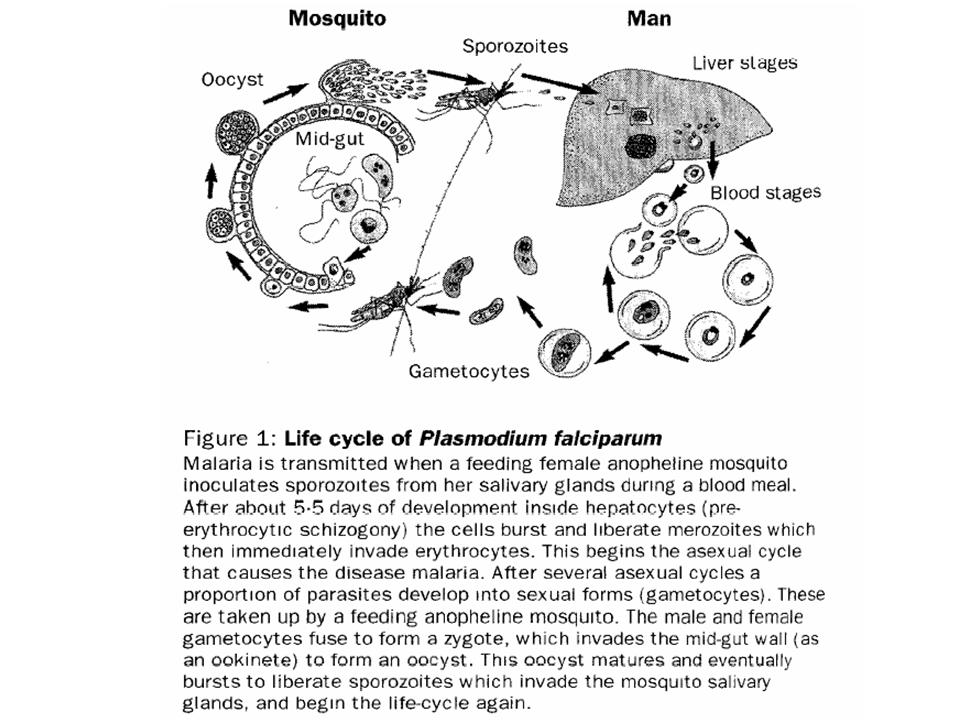
 | Phillips 2001 (fig. 1) | malaria parasite cycle | - | - | - | - | - | - |
|---|
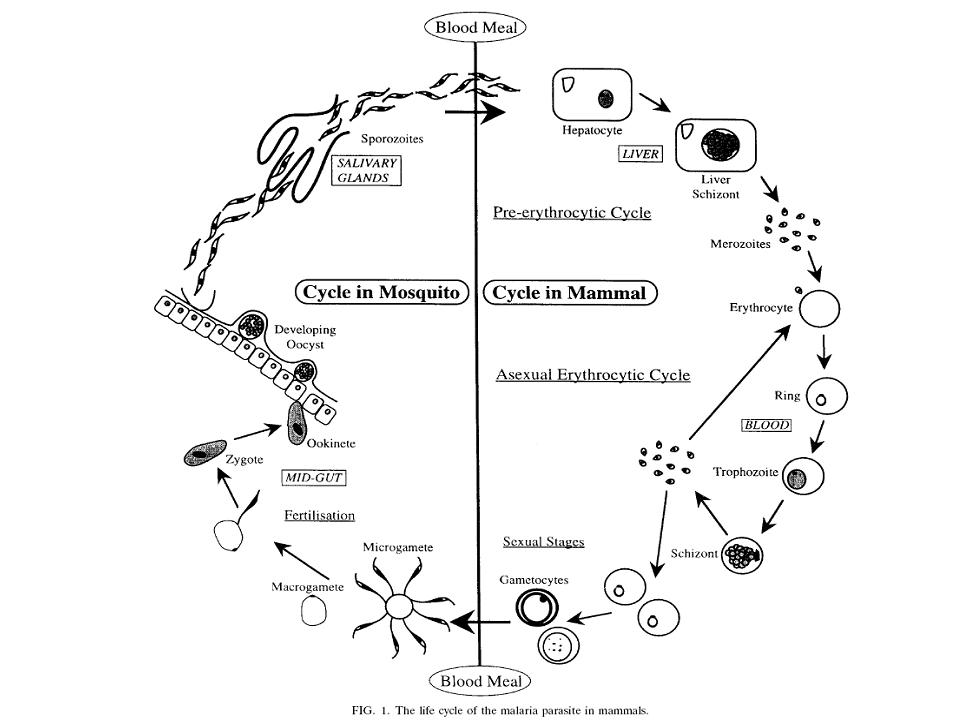
 | Price et al. 1996 (fig. 1) | malaria parasite cycle | - | - | - | - | - | - |
|---|
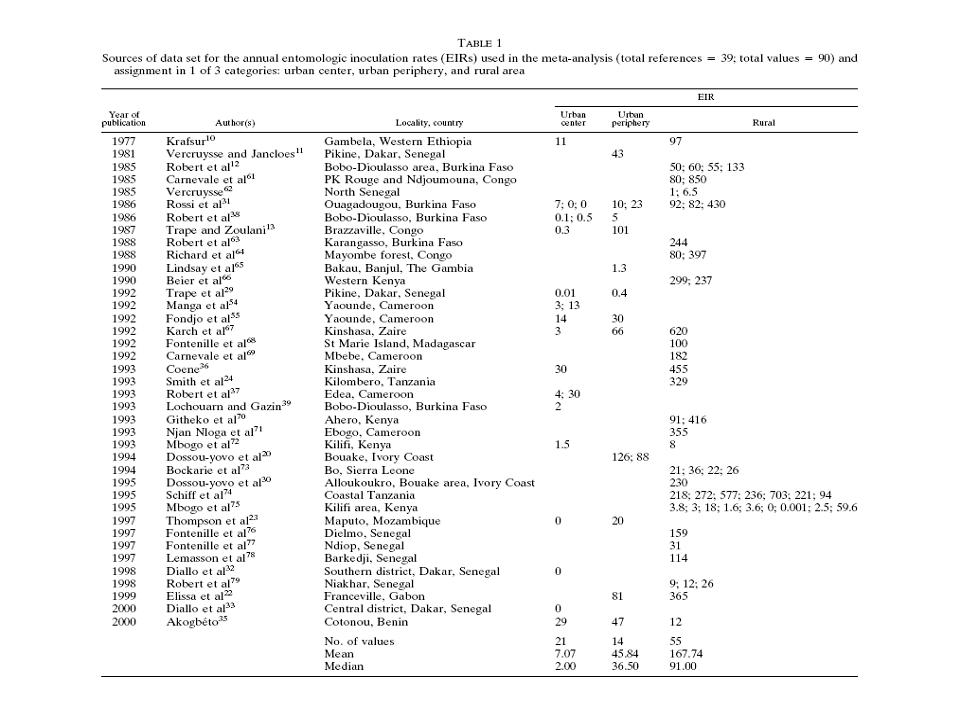
 | Robert et al. 2003 (fig. 1) | EIRa | sub-Saharan Africa | - | - | - | - | values for rural and urban sites |
|---|
 | Robert et al. 2003 (tab. 1) | EIRa | sub-Saharan Africa | - | - | - | - | values for rural and urban sites, sources |
|---|
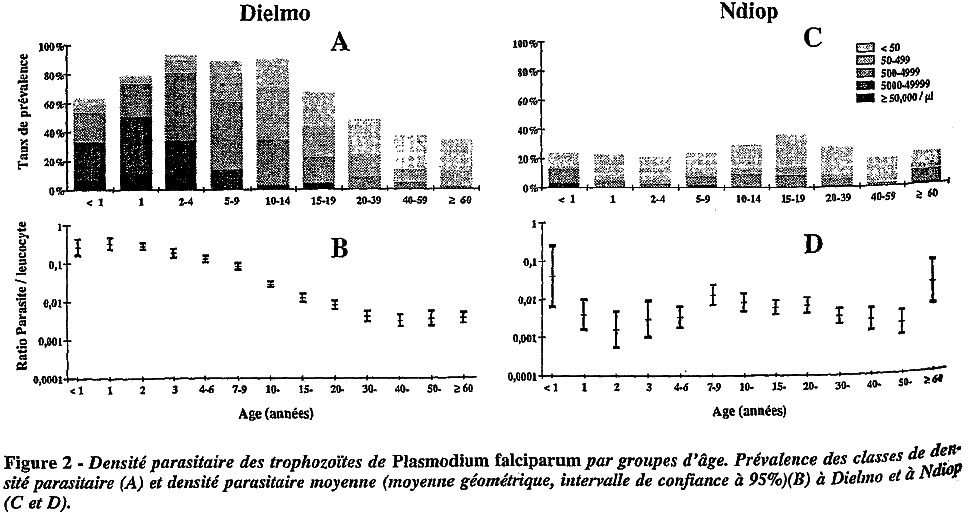
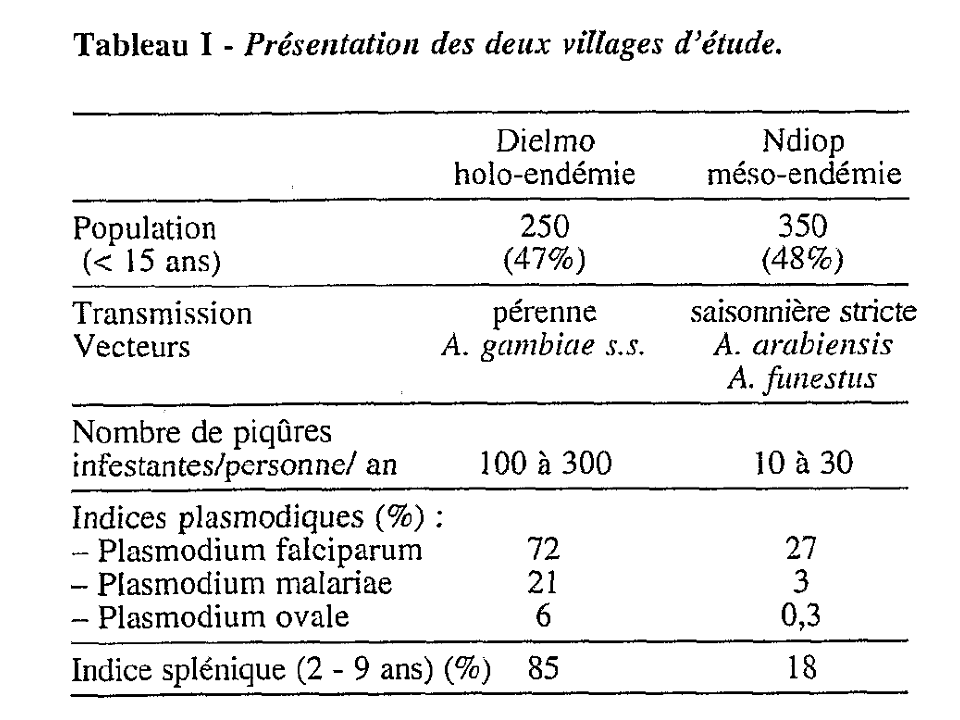
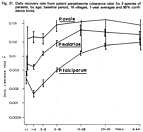
 | Rogier and Trape 1995 (fig. 2) | PR according to different age groups | Senegal | Dielmo, Ndiop | (13°45'N, 16°25'W), (13°41'N, 16°23'W) | 199001-199012 and 199301-199312, respectively | - | Dielmo is situated at a small river, that enables year around larval breeding sites |
|---|
 | Rogier and Trape 1995 (fig. 4) | parasite density according to different age groups | Senegal | Dielmo, Ndiop | (13°45'N, 16°25'W), (13°41'N, 16°23'W) | 199001-199012 and 199301-199312, respectively | - | Dielmo is situated at a small river, that enables year around larval breeding sites |
|---|
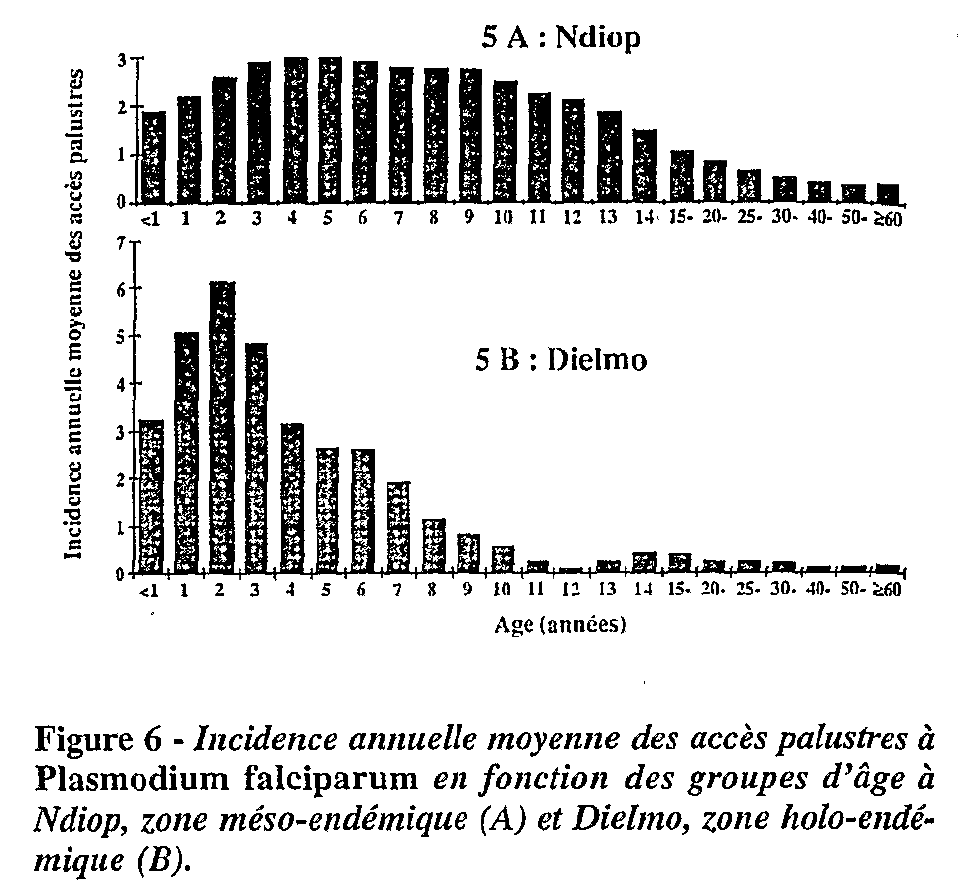
 | Rogier and Trape 1995 (fig. 6) | INCa according to different age groups | Senegal | Dielmo, Ndiop | (13°45'N, 16°25'W), (13°41'N, 16°23'W) | 199001-199012 and 199301-199312, respectively | - | Dielmo is situated at a small river, that enables year around larval breeding sites |
|---|
 | Rogier and Trape 1995 (tab. 1) | PR according to different malaria species | Senegal | Dielmo, Ndiop | (13°45'N, 16°25'W), (13°41'N, 16°23'W) | 199001-199012 and 199301-199312, respectively | - | children up to 15 years; Dielmo is situated at a small river, that enables year around larval breeding sites |
|---|
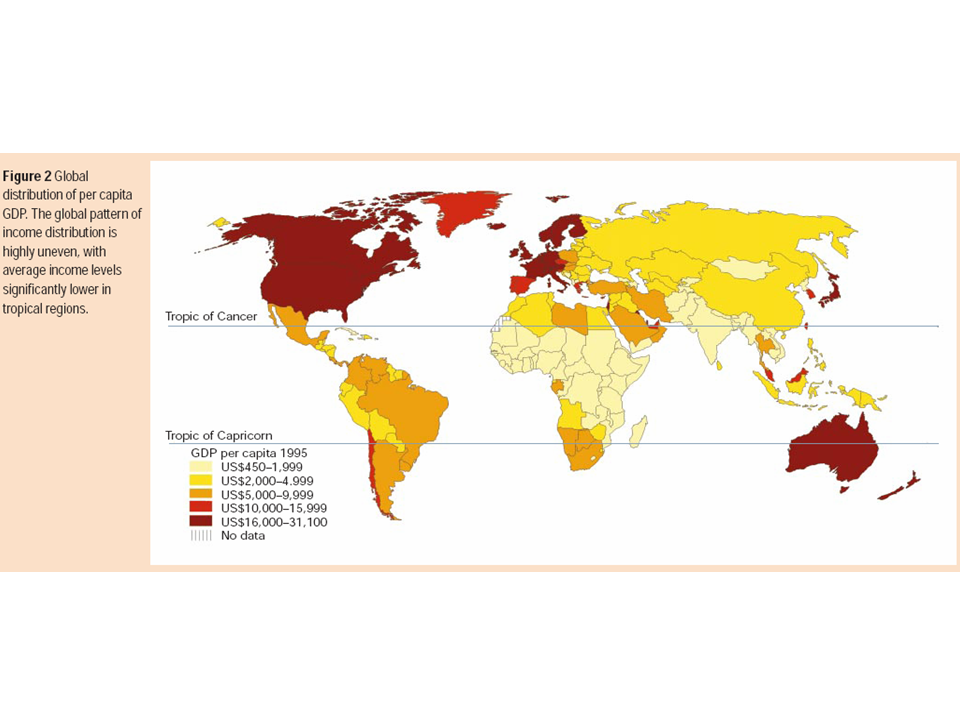
 | Sachs and Malaney 2002 (fig. 2) | gross national product per capita | world | - | - | 1995 | - | - |
|---|
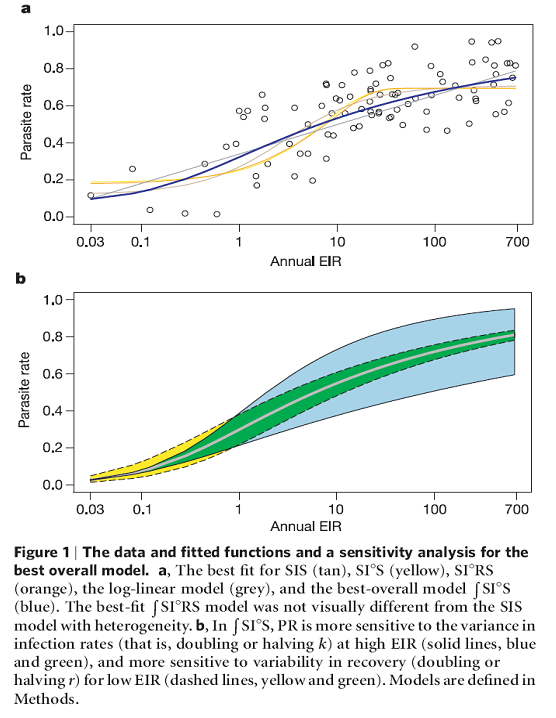
 | Smith et al. 2005 (fig. 1) | parasite ratio models by EIRa values | Africa | - | - | - | - | - |
|---|
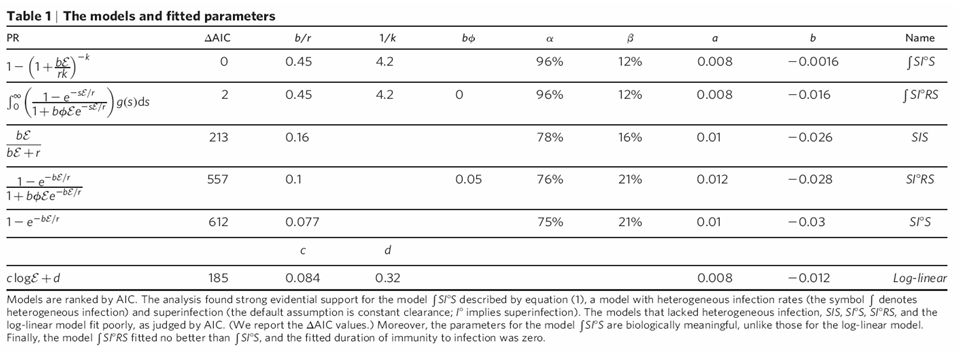
 | Smith et al. 2005 (tab. 1) | connection between EIRa and parasite ratio | Africa | - | - | - | - | data and fitted functions and a sensitivity analysis for the best overall model |
|---|
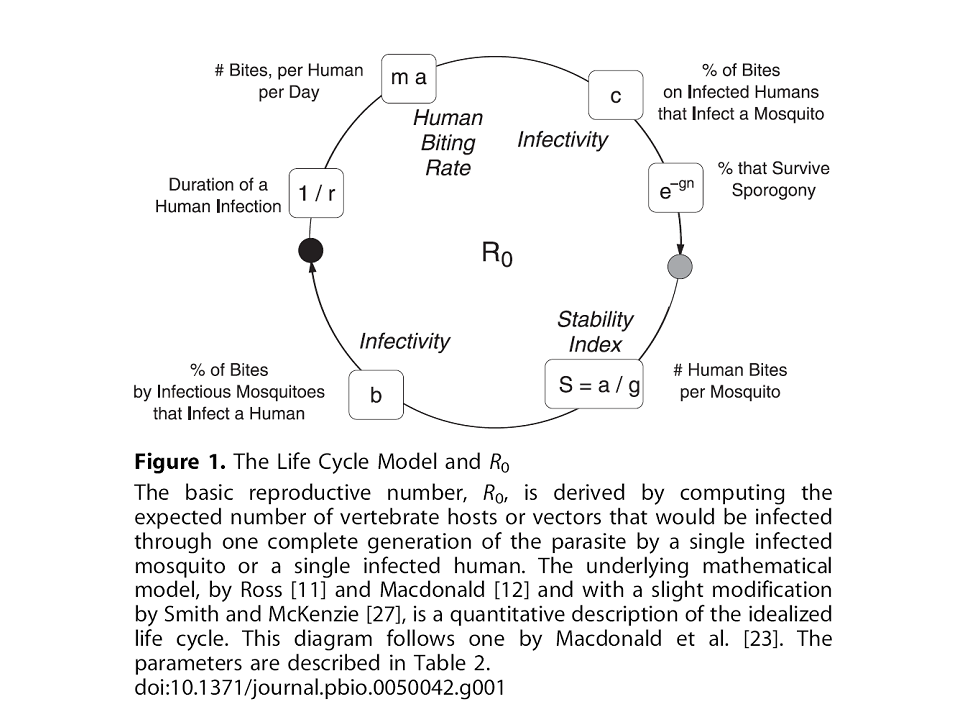
 | Smith et al. 2007 (fig. 1) | malaria life cycle model and R0 | - | - | - | - | - | - |
|---|
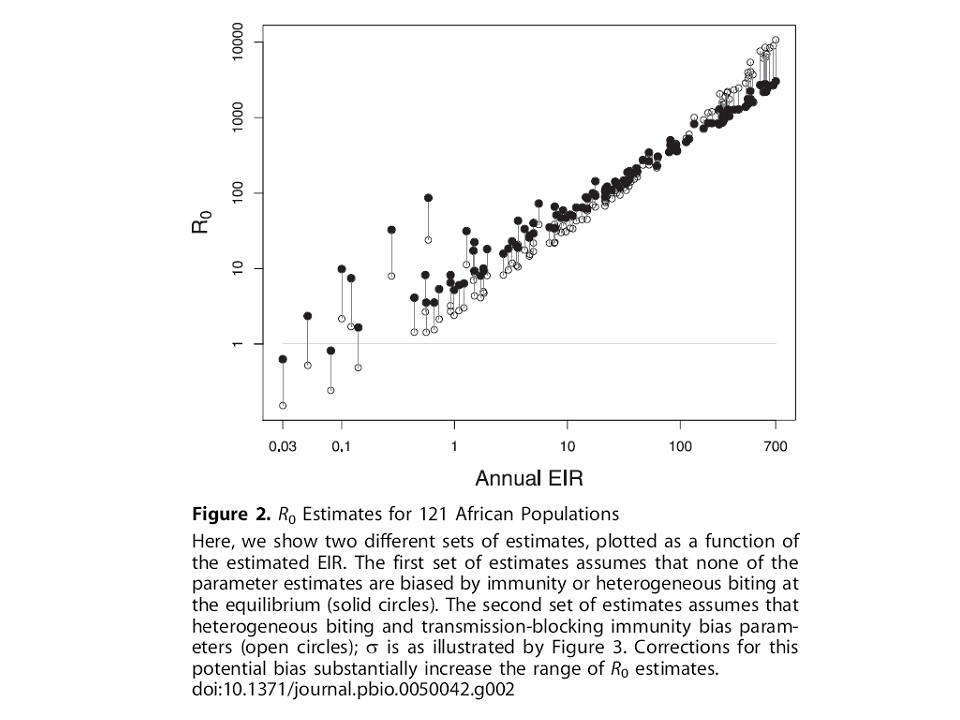
 | Smith et al. 2007 (fig. 2) | R0 esimates for 121 African populations | Africa | - | - | - | - | - |
|---|
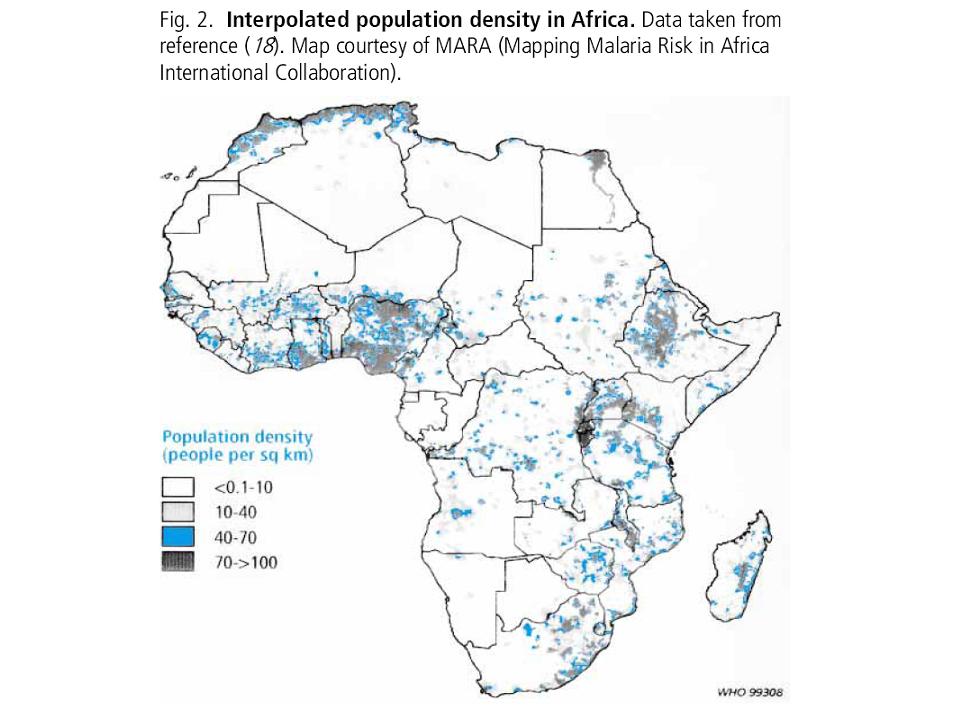
 | Snow et al. 1999a (fig. 2) | population density | Africa | - | - | - | - | - |
|---|
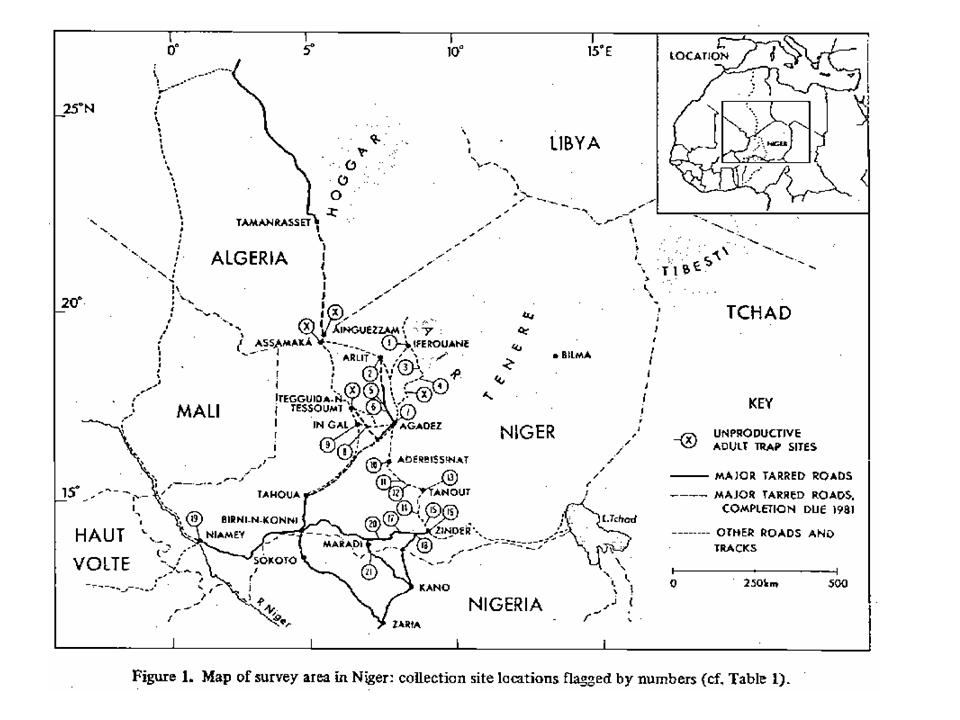
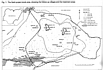
 | Stafford Smith 1981 (fig. 1) | map of survey area | Niger | - | - | - | - | - |
|---|
 | Stafford Smith 1981 (fig. 1 Zoom) | map of survey area | Niger | - | - | - | - | - |
|---|
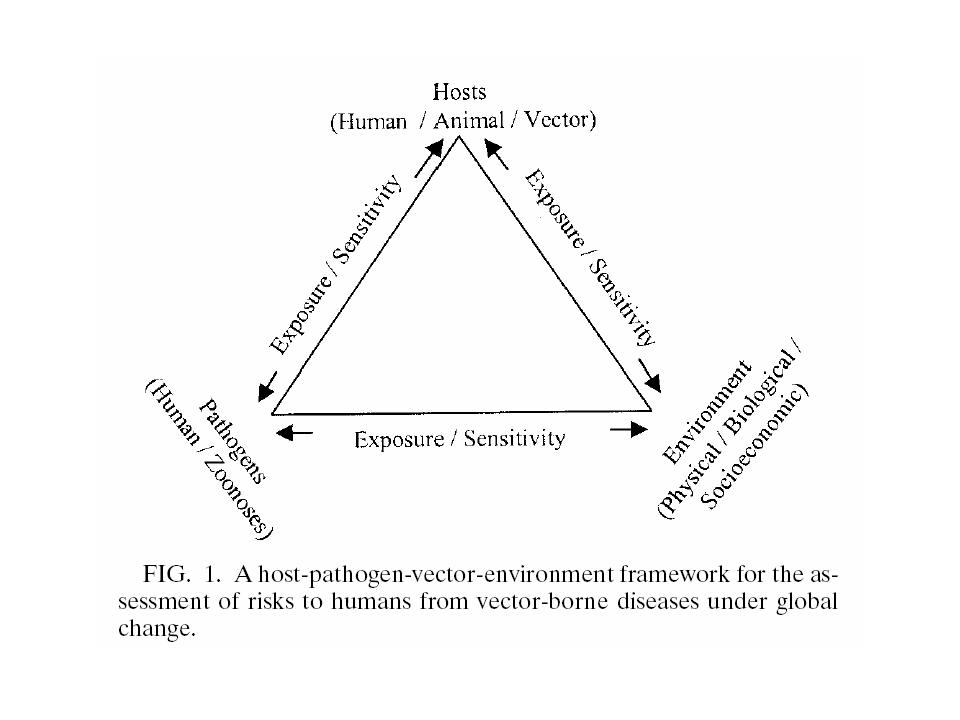
 | Sutherst 2004 (fig. 1) | a host-pathogen-vector-environment framework | - | - | - | - | - | flow chart |
|---|
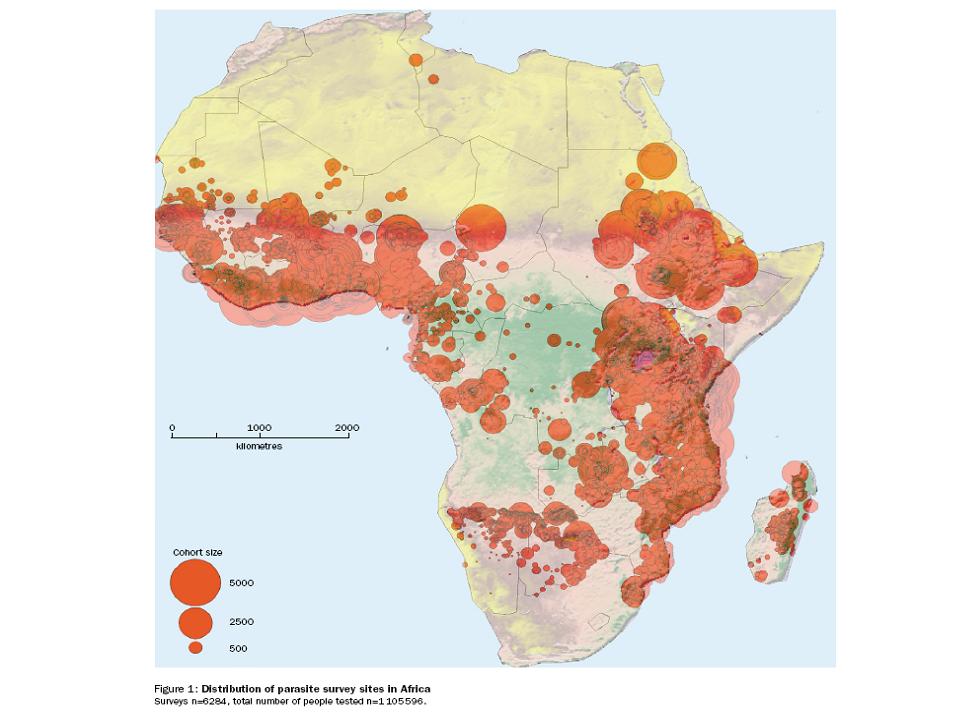
 | Tanser et al. 2003 (fig. 1) | distribution of parasite survey sites, orography | Africa | - | - | - | - | - |
|---|
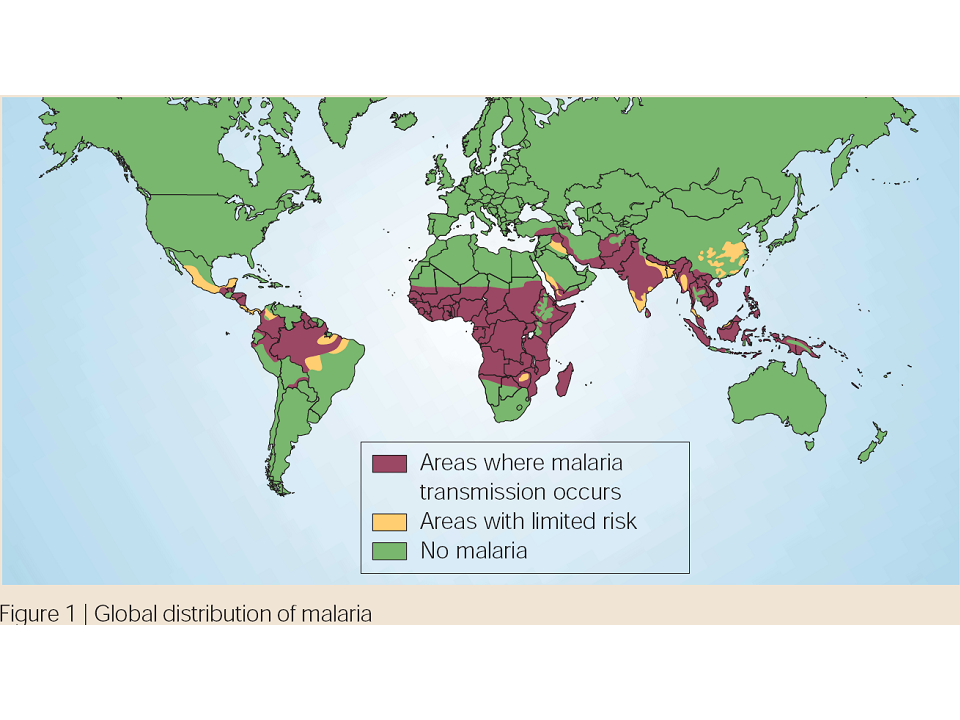
 | Toure and Oduola 2004 (fig. 1) | malaria distribution | global | - | - | - | - | - | - |
|---|
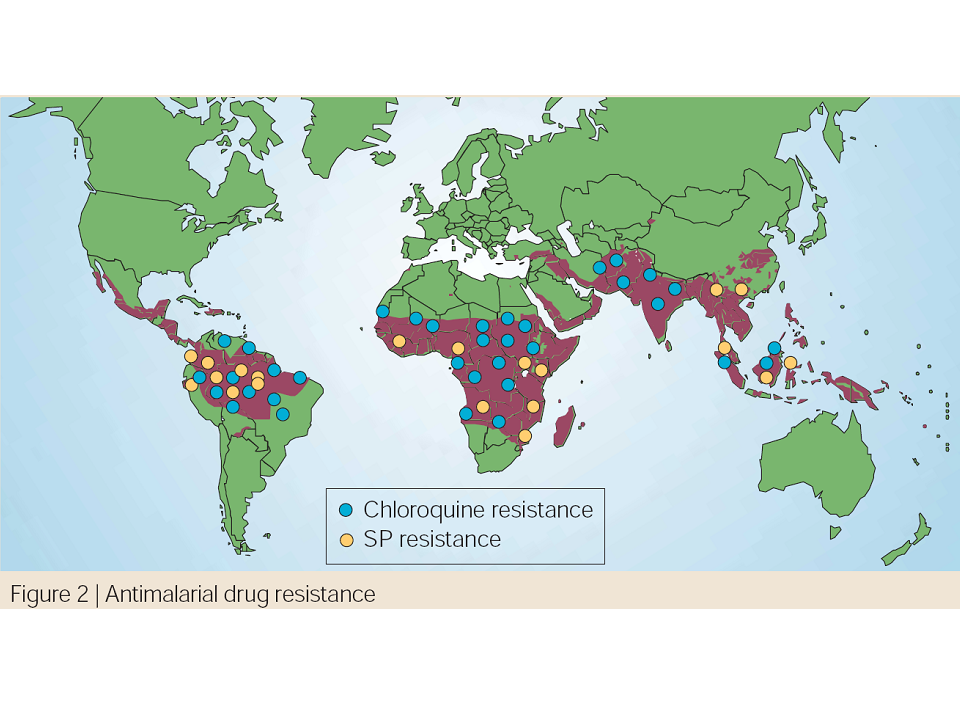
 | Toure and Oduola 2004 (fig. 2) | antimalarial drug resistance | - | - | - | - | - | - |
|---|
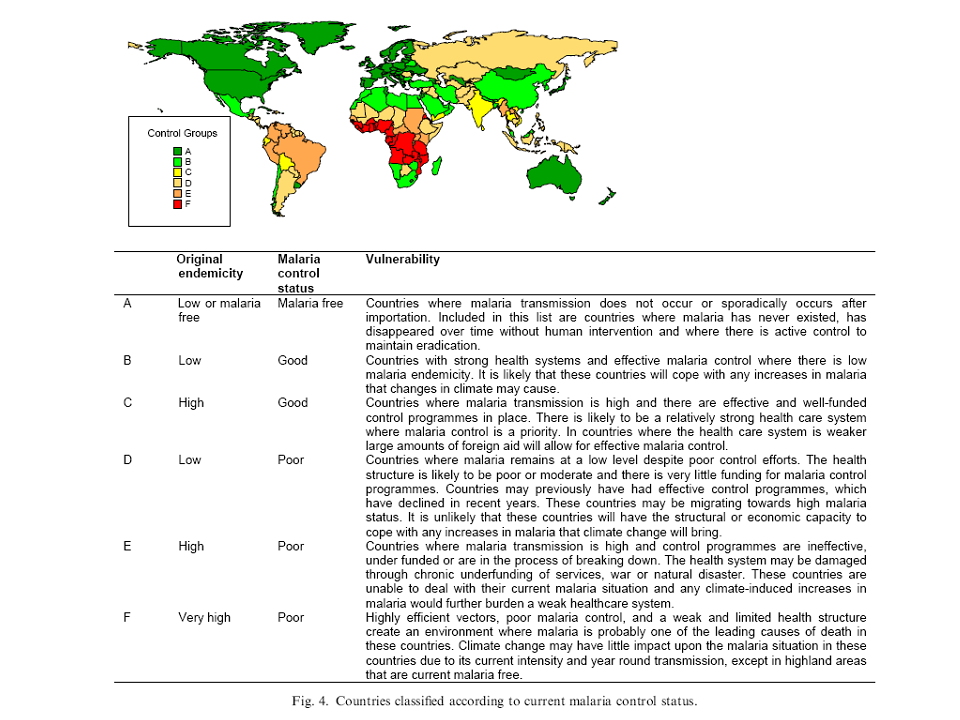
 | Van Lieshout et al. 2004 (fig. 4) | countries classified according to current malaria control status | global | - | - | 2003 | - | - |
|---|
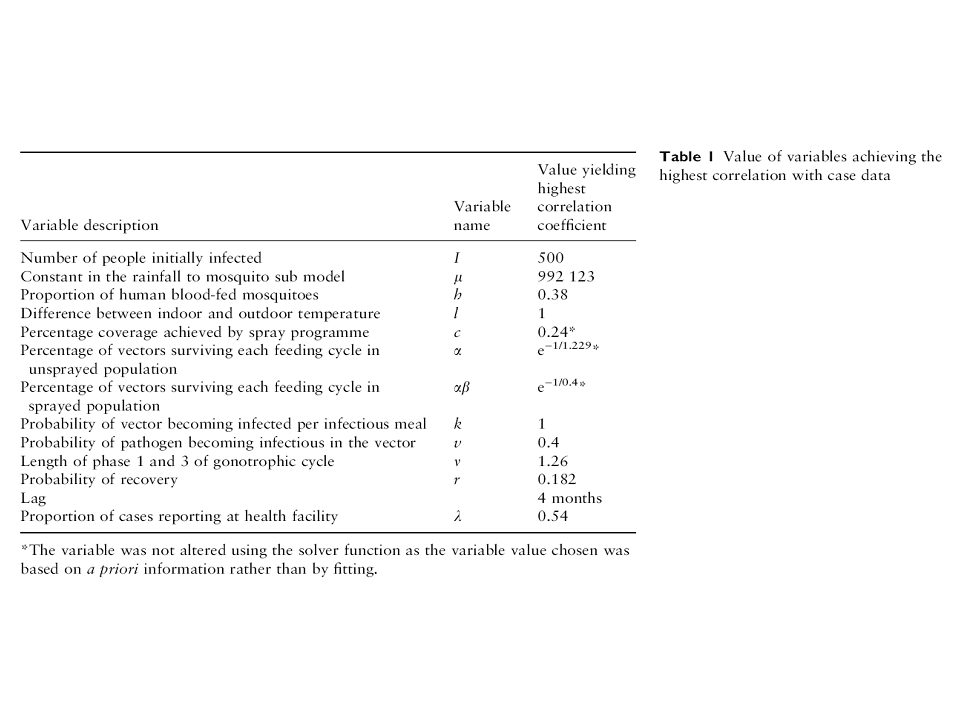
 | Worral et al. 2007 (tab. 1) | values of model variables | - | - | - | - | - | - |
|---|
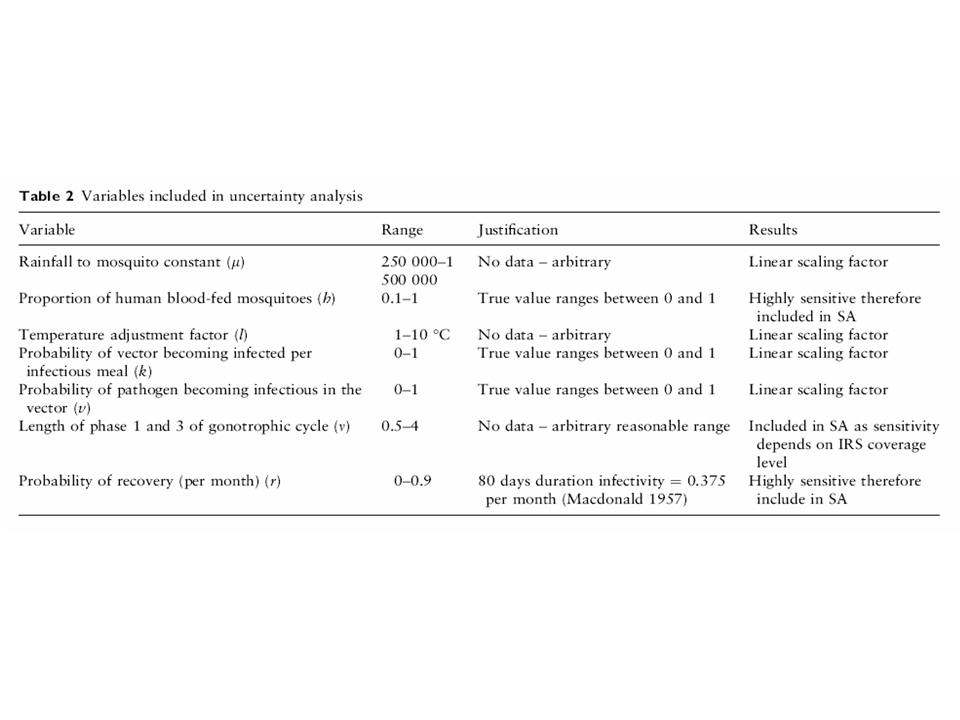
 | Worral et al. 2007 (tab. 2) | model variables included in an uncertainty analysis | - | - | - | - | - | includes arbitrary values |
|---|