| figure, table | reference | variable | location | area | position | period (YYY1M1-YYY2M2) | mosquito species | note |
|---|
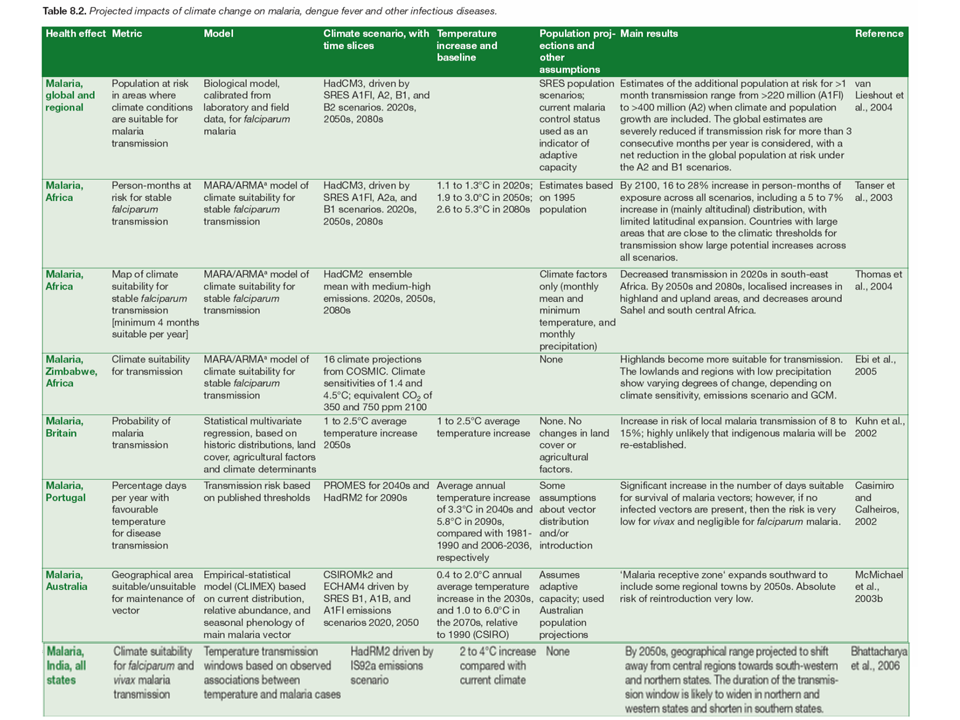
 | Confalonieri et al. 2007 (tab. 8.2) | projected impacs of climate change on malaria | Earth, Africa, Zimbabwe, Britain, Portugal, Australia, India | - | - | 2020-2100 | - | - |
|---|
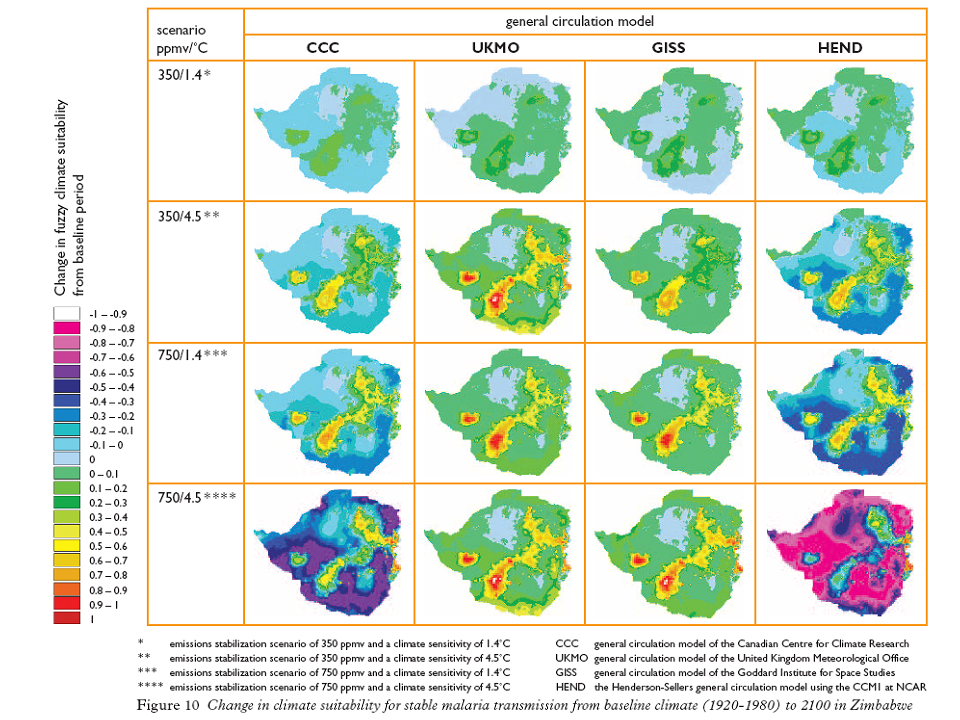
 | Hartman et al. 2002 (fig. 10) | change in fuzzy logic climate suitability for stable malaria transmission from baseline climate | Zimbabwe | - | - | 2100 vs. 1920-1980 | - | MDM results |
|---|
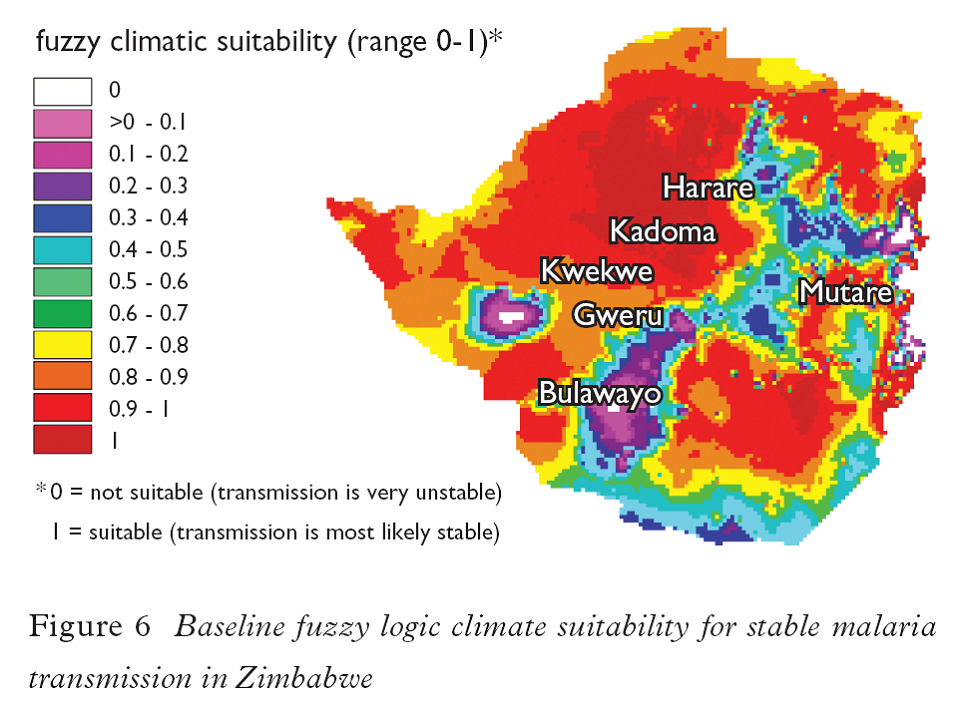
 | Hartman et al. 2002 (fig. 6) | fuzzy logic climate suitability for stable malaria transmission | Zimbabwe | - | - | 1920-1980 | - | MDM results |
|---|
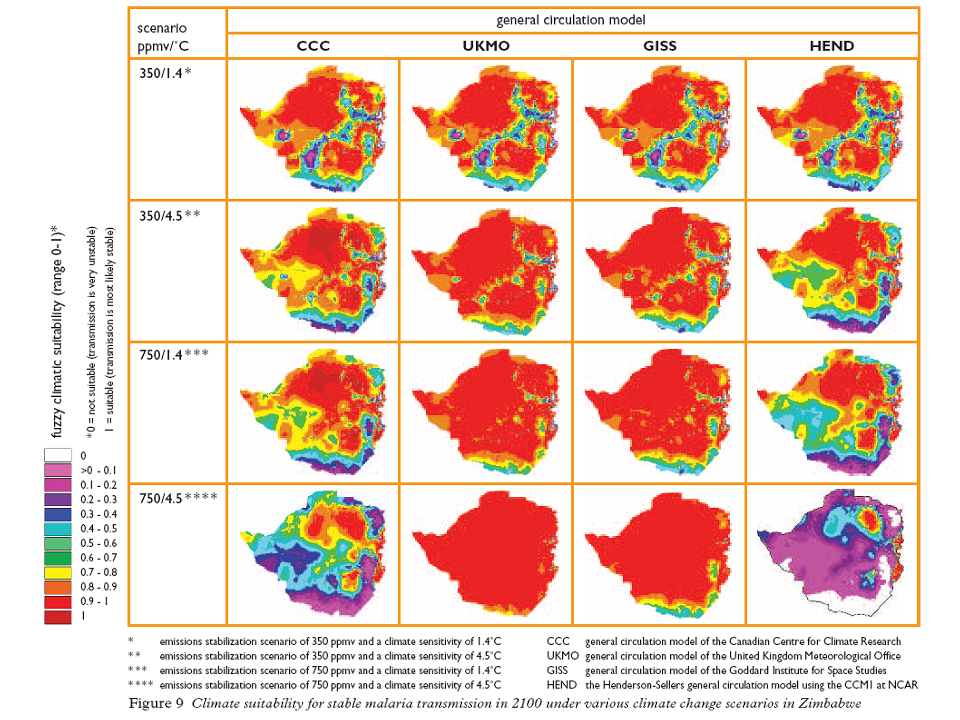
 | Hartman et al. 2002 (fig. 9) | fuzzy logic climate suitability for stable malaria transmission under various climate change scenarios | Zimbabwe | - | - | 2100 | - | MDM results |
|---|
 | Hartman et al. 2002 (tab. 1) | percentage with climate suitability for stable malaria transmission | Zimbabwe | - | - | 2100 | - | MDM results; stable: fuzzy logic values ≥ 0.9 |
|---|
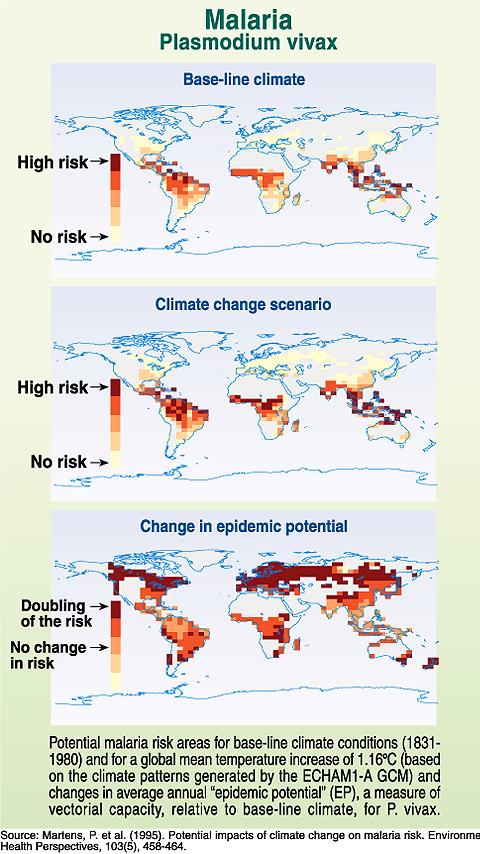
 | Martens et al. 1995b (fig. 4) | predicted malaria risk | world | - | - | 2100 vs. 1831-1980 | - | based on ECHAM1-A GCM and a measure of VC |
|---|
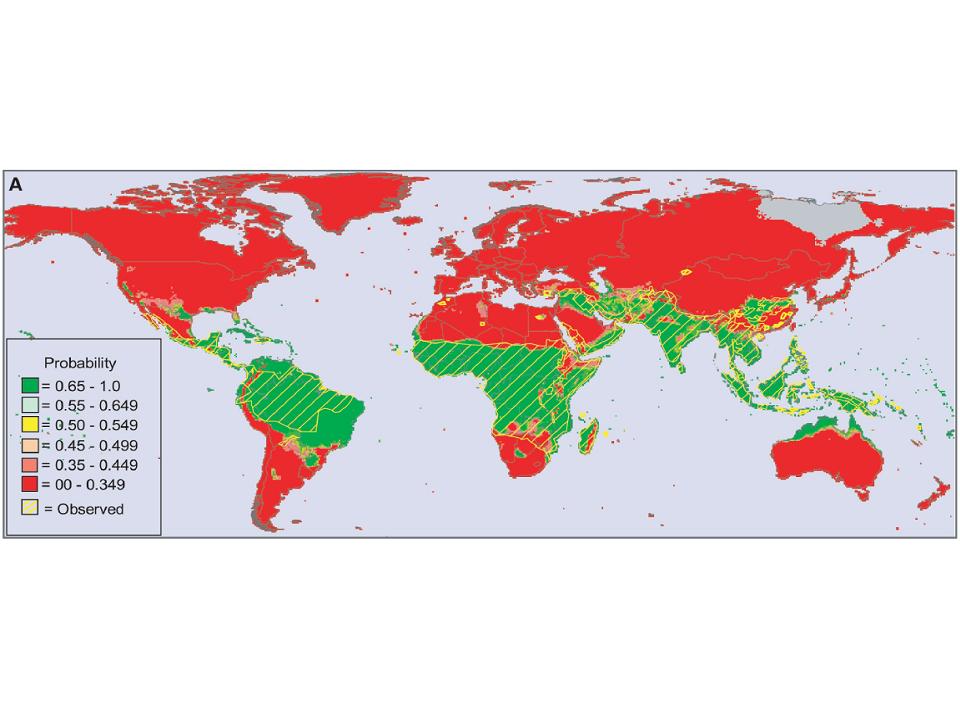
 | Rogers and Randolph 2000 (fig. 1A) | predicted and observed malaria distribution | world | - | - | 2000 | - | - |
|---|
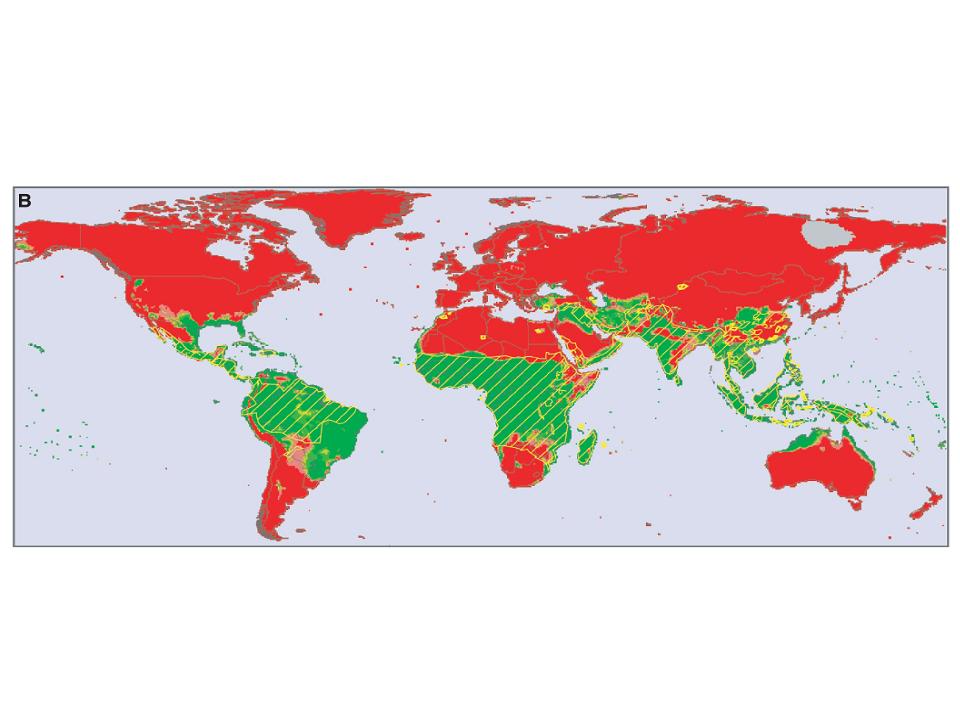
 | Rogers and Randolph 2000 (fig. 1B) | observed and predicted malaria distribution | world | - | - | 2000, 2050 | - | - |
|---|
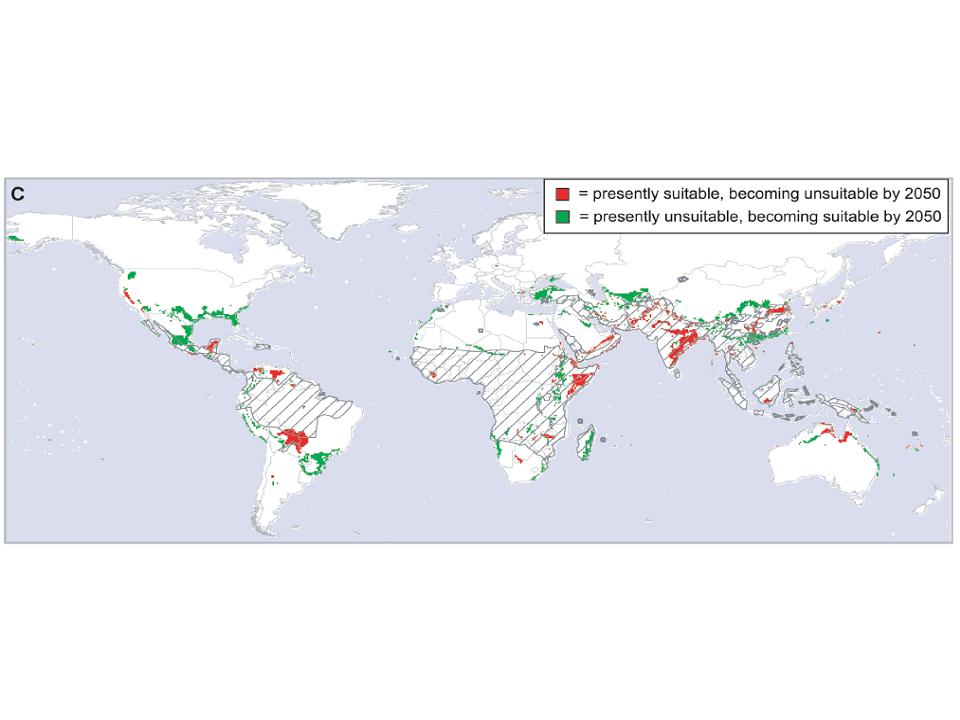
 | Rogers and Randolph 2000 (fig. 1C) | differences between predicted malaria distributions in 2050 and 2000 | world | - | - | - | - | - |
|---|
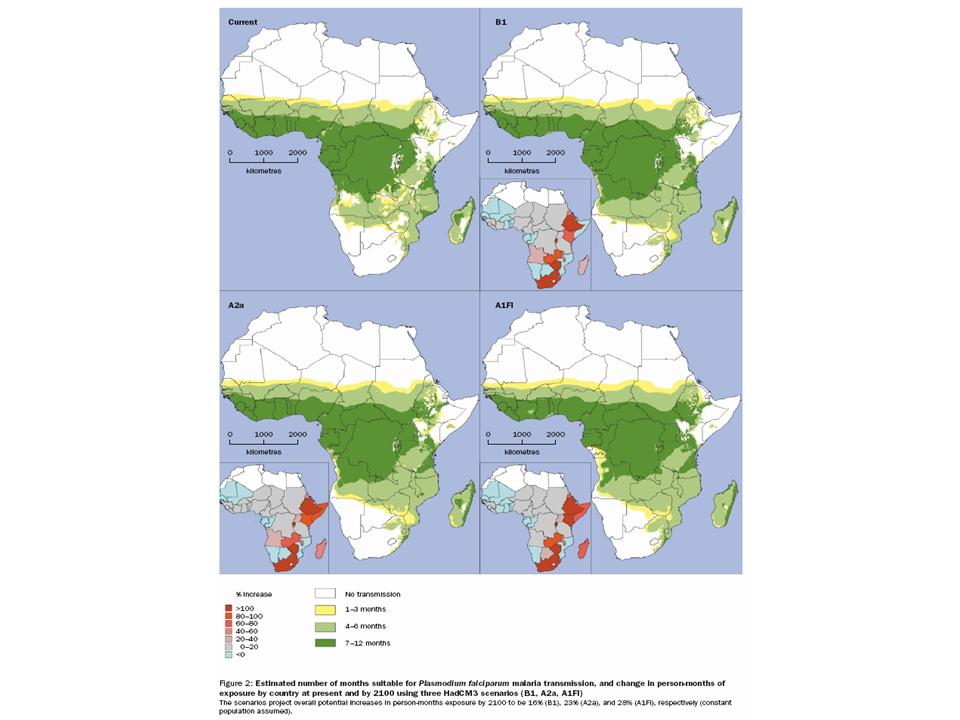
 | Tanser et al. 2003 (fig. 2) | predicted numbers of month suitable for malaria transmission relative to different climate scenarios | Africa | - | - | present climate, 2100 scenario | - | - |
|---|
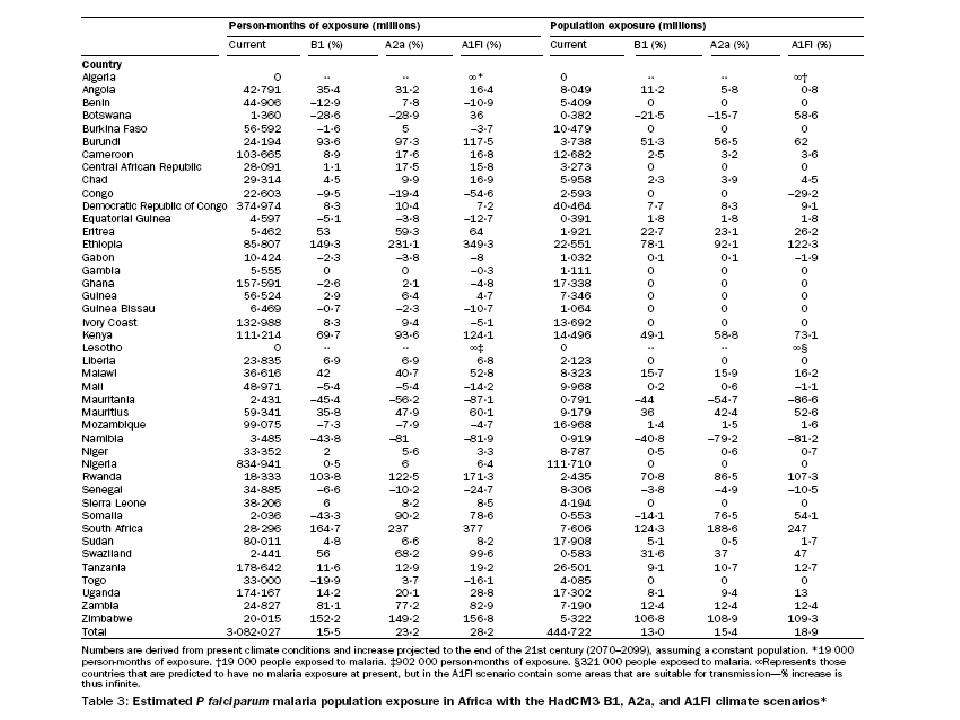
 | Tanser et al. 2003 (tab. 3) | person-months of malaria exposure and population exposure | Africa | - | - | present climate, 2100 scenario | - | - |
|---|
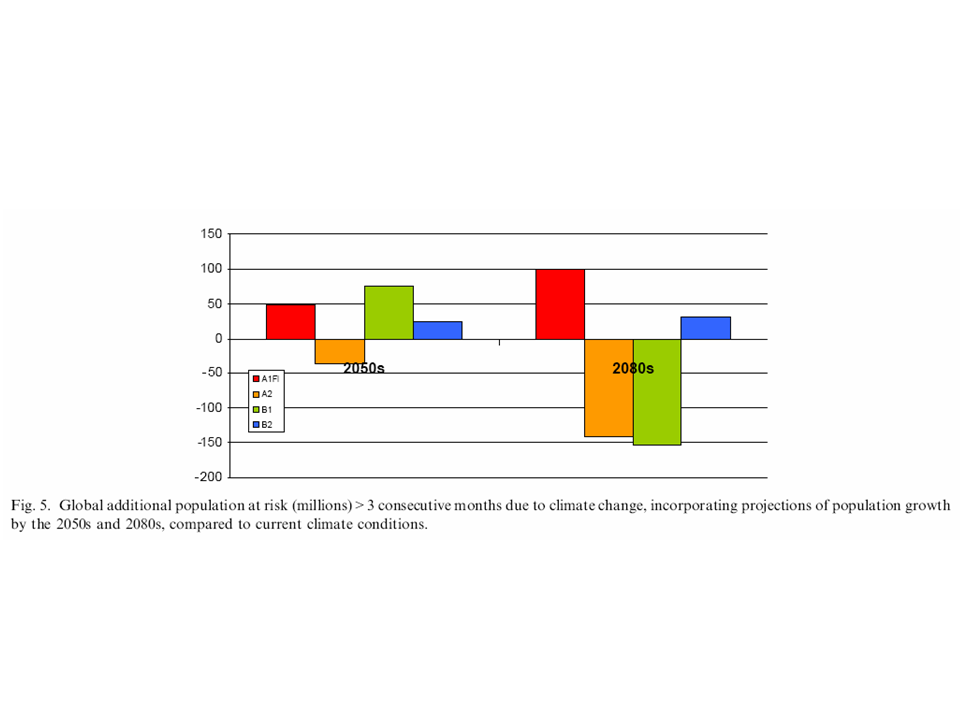
 | Van Lieshout et al. 2004 (fig. 5) | additional population at risk under four SRES climate scenarios | global | - | - | 2050s, 2080s vs. 1961-1990 | - | - |
|---|
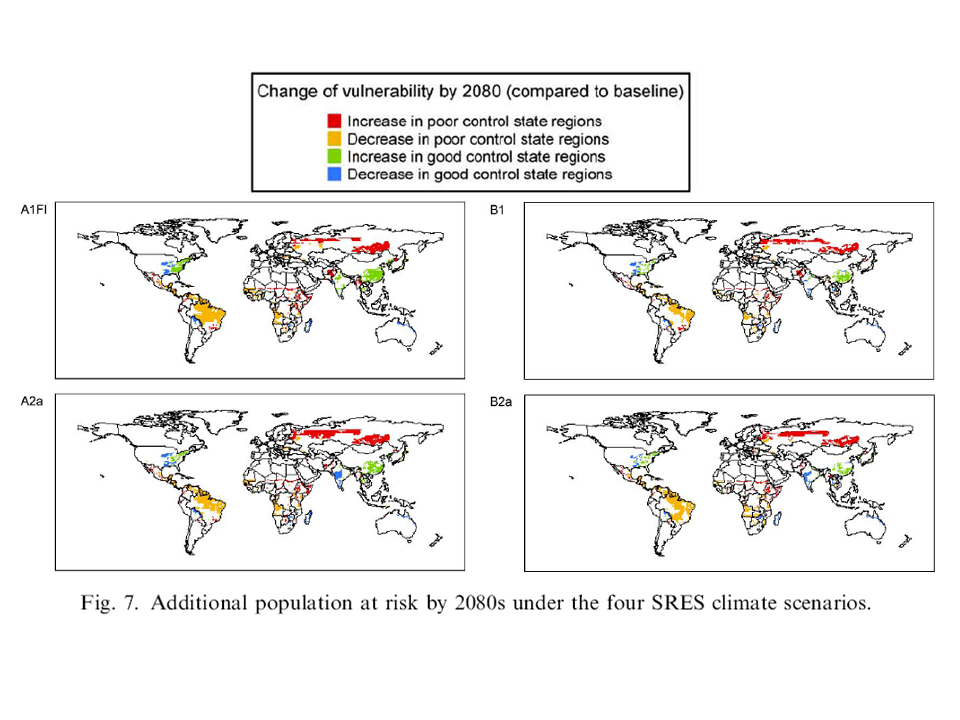
 | Van Lieshout et al. 2004 (fig. 7) | additional population at risk under four SRES climate scenarios | global | - | - | 2080s vs. 1961-1990 | - | - |
|---|
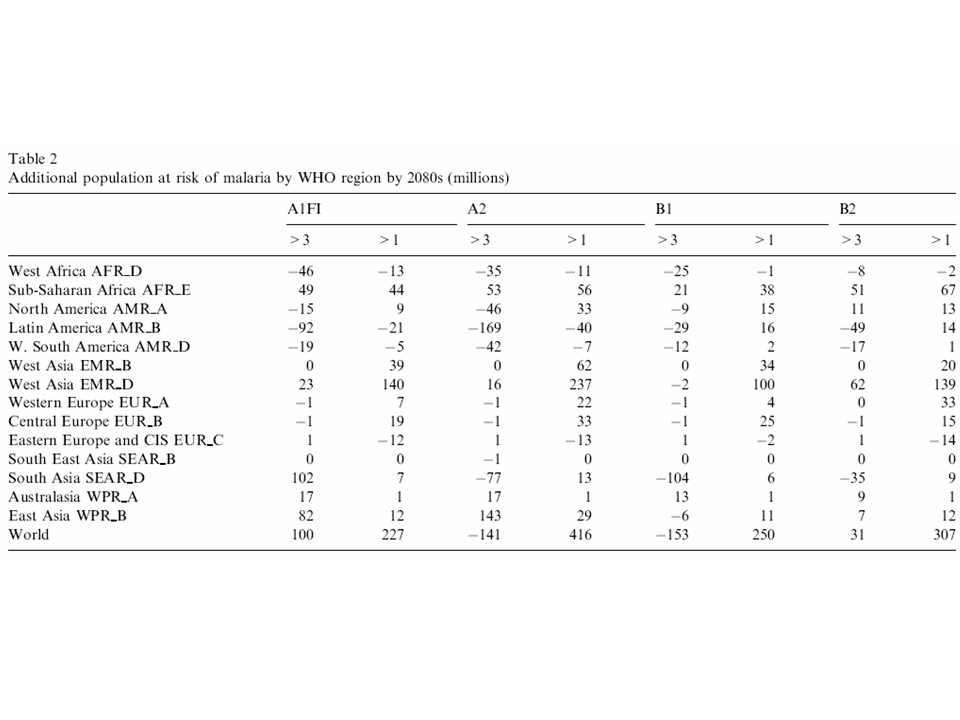
 | Van Lieshout et al. 2004 (tab. 2) | additional population at risk of malaria by WHO region | global | - | - | 2080s | - | - |
|---|